Sunday, April 27, 2014

More analytic capabilities added to Energy3D


Add any number of sensors to a house.
According to Wikipedia, computer-aided engineering (CAE) is typically done through the following steps:
  1. Pre-processing: This step defines the 3D geometry, the initial conditions, and the boundary conditions of the model.
  2. Analysis solver: This step predicts the properties of the model and, sometimes, their time evolution.
  3. Post-processing: This step visualizes the results of the analysis using maps and graphs.
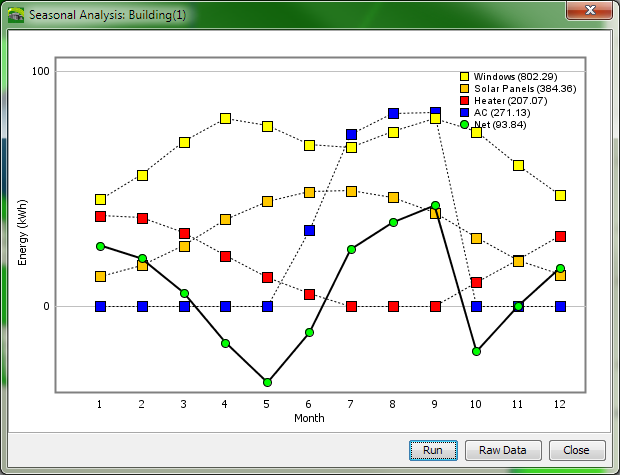
Sensor graphs.
In real engineering practices, these three steps are often done using different computer programs, run on different computers, or even carried out by different people. This time-consuming and complicated process often prevents CAE tools from being productive in the classroom, as many students cannot overcome the long learning curve in a very short time permitted by their schedules.

One of the critical features that distinguish our Energy3D software from other CAD tools is that it eliminates all these gaps and delays. From day one of the Energy3D project, we have envisioned a CAD tool that supports concurrent inquiry and design, thus allowing students to explore many design options with scientific inquiry and rapidly get feedback to help them make design decisions. This is an essential innovation that makes a CAD tool broadly useful for teaching engineering design skills rather than just computer drawing skills.
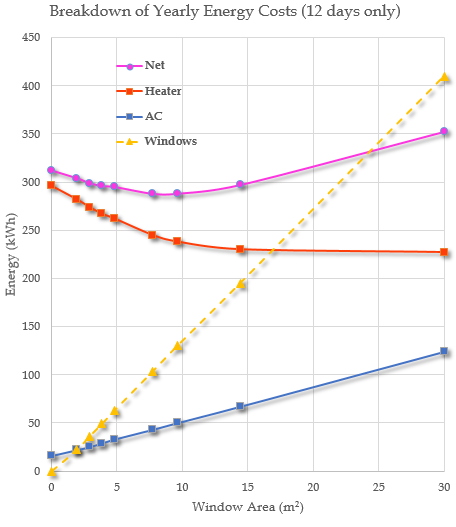
Construction cost.

To move closer to our goal, we have recently added many new, exciting features to Energy3D Version 3.0 to greatly advance its analytic capacity. These features include:

1) Virtual sensors. Students can add any number of sensor modules to any surface of the buildings under design to measure insolation density and heat transfer at the building envelope. This is analogous to using sensor-based data loggers in building diagnostics. Virtual sensors will allow Energy3D to eventually support systems design, creating opportunities for students to practice systems thinking in the context of building intelligence. For example, students will be able to simulate Google's NEST Learning Thermostat and explore how much energy can be saved using these smart house technologies.

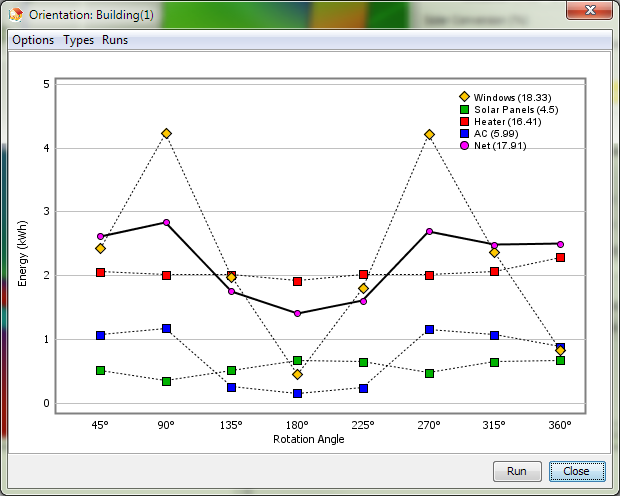
Energy vs. orientation
2) Construction cost analysis. Any real engineering project is subject to a budgetary limit. While students are designing, Energy3D predicts the construction cost and breaks it down into categories. They will get a warning when a design goes over a budget, creating a financial constraint for a design project.

3) Building orientation optimization. Students can rotate a building and explore how energy can be saved by simply choosing an optimal orientation.

Together with the features of seasonal analyses announced before, Energy3D provides an increasingly comprehensive simulation environment for learning engineering design in the context of sustainable housing.

Thursday, April 17, 2014

Green building design with Energy3D: How big should south-facing windows be?

Many people know that south-facing windows can help to heat a house in the winter because they let a lot of sunlight in. Exactly how much of the south-facing wall should we allocate to windows? What are the downsides? How can we avoid them? Our Energy3D software allows students to explore the problems and find the solutions.

Figure 1


Suppose we have a simple house like the one shown in Figure 1 and we are in the Boston area. Energy3D supports students to try a design choice, run a simulation, collect the data, analyze the result, and evaluate the solution -- all in real time as is shown in the video in this post. Energy3D's powerful simulation and analysis tools provide instantaneous feedback to students so that their design processes can be guided and informed by the scientific and engineering principles built in the software. Let's use the investigation of south-facing windows described above as an example.


Figure 2 (Excel graph)
Suppose a student follows the design trajectory as shown in Figure 1. A challenge is to keep the yearly energy cost needed to maintain the temperature of the house at 20℃ to be as low as possible. The student begins with adding a small window to the south side of the house. By running the seasonal energy analysis tool in Energy3D, she immediately discovers that, by adding a small window, she can cut the energy cost a bit. Then she enlarges the window and finds that more energy can be saved. So she goes on to increase the size of the window. However, she finds that, at some point, larger windows on the south side start to cost more energy. After she adds two large windows, the energy cost increases over 15%, compared with the case of no window at all. Figure 2 shows the energy cost, broken down to heater and AC, as a function of the window area. That doesn't quite make sense to her. So she has to stop and think about why.
Figure 3 (Energy3D graph)


The trend in Figure 2 suggests that, with the enlargement of windows on the south side, the cooling cost continues to rise while the heating cost levels off. A monthly breakdown in Figure 3 reveals this trend more clearly. As shown by the golden dashed line in Figure 2, the solar heating through the windows increases rapidly when their total area gets enlarged.

Figure 4 (Energy3D graph)
Figure 5 (Energy3D graph)
If she wants to keep the large window area in the south side (for natural lighting and sanity of the occupants!), she has to reduce the solar heating effect through the windows in the summer. One way to do this is to plant tall deciduous trees in front of the windows as shown in Figure 1. The trees provide shading for the windows in the summer but let sunlight shine through to the windows in the winter (in Energy3D, deciduous trees have leaves from May 1st to November 30th). Figure 4 shows the effect of the two deciduous trees on the solar gain through the two south-facing windows. From the graph, she can see that the trees cut down the solar heating in the summer. As a result, the AC cost is reduced, as shown in Figure 5, whereas the heating cost is almost unchanged.

She concludes that, with the trees planted to the south of the house, the net energy cost over a year can be decreased to lower than the case of no window at all, providing an acceptable solution that takes care of view, lighting, and landscaping.

The Energy3D graphs in this blog post show that students can keep the results of previous runs (the curve of each run is labeled by a number) and superimpose new data on top of them. As the data view can get quite complex, Energy3D provides options to turn on/off data types and runs. The embedded video shows how those features work for visualizing and analyzing the simulation results.

PS: Some readers may notice that our calculations predict higher AC cost in September than in August or July. This is because when those calculations were done, the house had no window on the east or west side. Adding windows to those sides, the AC cost will peak around July or August -- even when the trees are not present.

Sunday, April 6, 2014

Building performance analyses in Energy3D

Energy3D (Tree image credit: SketchUp Warehouse and Ethan McElroy)
A zero-energy building is a building with zero net energy consumption over a year. In other words, the total amount of energy used by the building on an annual basis is equal to or even less than the amount of renewable energy it produces through solar panels or wind turbines. A building that produces more renewable energy than it consumes over the course of a year is sometimes also called an energy-plus building. Highly energy-efficient buildings hold a crucial key to a sustainable future.


One of the goals of our Energy3D software is to provide a powerful software environment that students can use to learn about how to build a sustainable world (or understand what it takes to build such a world). Energy3D is unique because it is based on computational building physics, done in real time to produce interesting heat map visualization resembling infrared thermography. The connections to basic science concepts such as heat and temperature make the tool widely applicable in schools. Furthermore, at a time when teachers are required by the new science standards to teach basic engineering concepts and skills in classrooms, this tool may be even more relevant and useful. The easy-to-use user interface enables students to rapidly sketch up buildings of various shapes, creating a deep design space that provides many opportunities of exploration, inquiry, and learning.


In the latest version of Energy3D (Version 3.0), students can compute the energy gains, losses, and usages of a building over the course of a year. These data can be used to analyze the energy performance of the building under design. These results can help students decide their next steps in a complex design project. Without these simulation data to rationalize design choices, students' design processes would be speculative or random.

A complex engineering design project usually has many elements and variables. Supporting students to investigate each individual element or variable is key to helping them develop an understanding of the related concept. Situating this investigation in a design project enables students to explore the role of each concept on system performance. With the analytic tools in Energy3D, students can pick an individual building component such as a window or a solar panel and then analyze its energy performance. This kind of analysis can help students determine, for example, where a solar panel should be installed and which direction it should face. The video in this post shows how these analytic tools in Energy3D work.