We are pleased to announce that the National Science Foundation has awarded the Concord Consortium, Purdue University, and the University of Virginia
a $3 million, four-year collaborative project to conduct research and development on SmartCAD, an intelligent learning system that informs engineering design of students with automatic feedback generated using computational analysis of their work.
Engineering design is one of the most complex learning processes because it builds on top of multiple layers of inquiry, involves creating products that meet multiple criteria and constraints, and requires the orchestration of mathematical thinking, scientific reasoning, systems thinking, and sometimes, computational thinking. Teaching and learning engineering design becomes important as it is now officially part of the Next Generation Science Standards in the United States. These new standards mandate every student to learn and practice engineering design in every science subject at every level of K-12 education.
 |
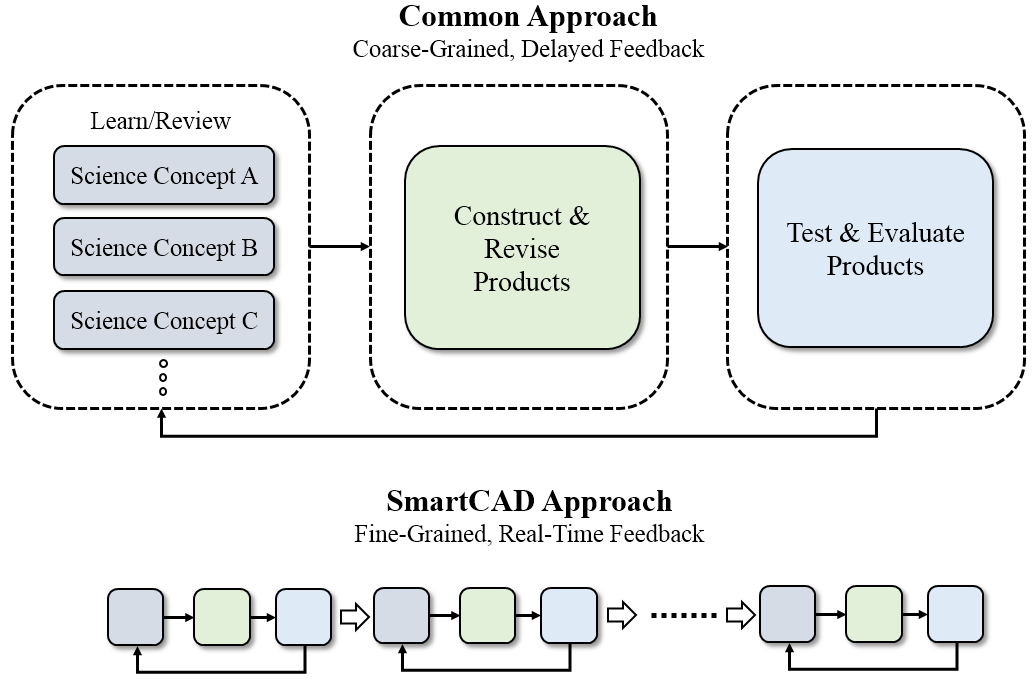
| Figure 1 |
In typical engineering projects, students are challenged to construct an
artifact that performs specified functions under constraints. What makes engineering design different from other design practices such as art design is that engineering design must be guided by scientific principles and the end products must operate predictably based on science. A common problem observed in students' engineering design activities is that their design work is insufficiently informed by science, resulting in the reduction of engineering design to drawing or crafting. To circumvent this problem, engineering design curricula often encourage students to learn or review the related science concepts and practices before they try to put the design elements together to construct a product. After students create a prototype, they then test and evaluate it using the governing scientific principles, which, in turn, gives them a chance to deepen their understanding of the scientific principles. This common approach of learning is illustrated in the upper image of Figure 1.
There is a problem in the common approach, however. Exploring the form-function relationship is a critical inquiry step to understanding the underlying science. To determine whether a change of form can result in a desired function,
students have to build and test a physical prototype or rely on the
opinions of an instructor. This creates a delay in getting feedback at
the most critical stage of the learning process, slowing down the
iterative cycle of design and cutting short the exploration in the
design space. As a result of this delay, experimenting and evaluating "micro ideas"--very small stepwise ideas such as those that investigate a design parameter at a time--through building, revising, and testing physical prototypes becomes impractical in many cases. From the perspective of learning, however, it is often at this level of granularity that foundational science and engineering design ultimately meet.
 |
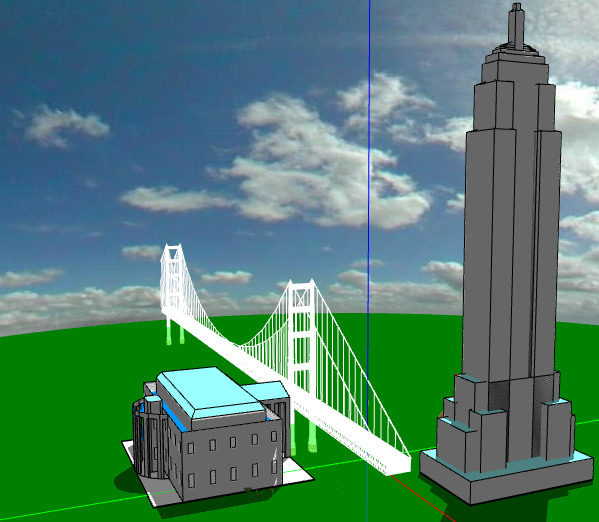
| Figure 2 |
All these problems can be addressed by
supporting engineering design with a computer-aided design (CAD)
platform that embeds powerful science simulations to provide formative
feedback to students in a timely manner. Simulations based on solving fundamental equations in science such as Newton’s Laws model the real
world accurately and connect many science concepts coherently. Such
simulations can computationally generate objective feedback about a
design, allowing students to rapidly test a design idea on a scientific
basis. Such simulations also allow the connections between design elements and science concepts to be explicitly established through fine-grained feedback, supporting students to make informed design decisions for each design element one at a time, as illustrated by the lower image of Figure 1. These scientific simulations give the CAD software tremendous disciplinary intelligence and instructional power, transforming it into a SmartCAD system that is capable of guiding student design towards a more scientific end.
Despite these advantages, there are very few developmentally
appropriate CAD software available to K-12 students—most CAD software
used in industry not only are science “black boxes” to students, but
also require a cumbersome tool chaining of pre-processors, solvers, and
post-processors, making them extremely challenging to use in secondary
education. The SmartCAD project will fill in this gap with key
educational features centered on guiding student design with feedback
composed from simulations. For example, science simulations can be used to analyze student design artifacts and
compute their distances to specific goals to detect whether students are
zeroing in towards those goals or going astray. The development of these features will also draw upon decades of research on formative assessments of complex learning.

