Thursday, December 31, 2015

Chemical imaging using infrared cameras

Figure 1: Evaporative cooling
Scientists have long relied on powerful imaging techniques to see things invisible to the naked eye and thus advance science. Chemical imaging is a technique for visualizing chemical composition and dynamics in time and space as actual events unfold. In this sense, infrared (IR) imaging is a chemical imaging technique as it allows one to see temporal and spatial changes of temperature distribution and, just like in other chemical imaging techniques, infer what is occurring at the molecular level based on these information.

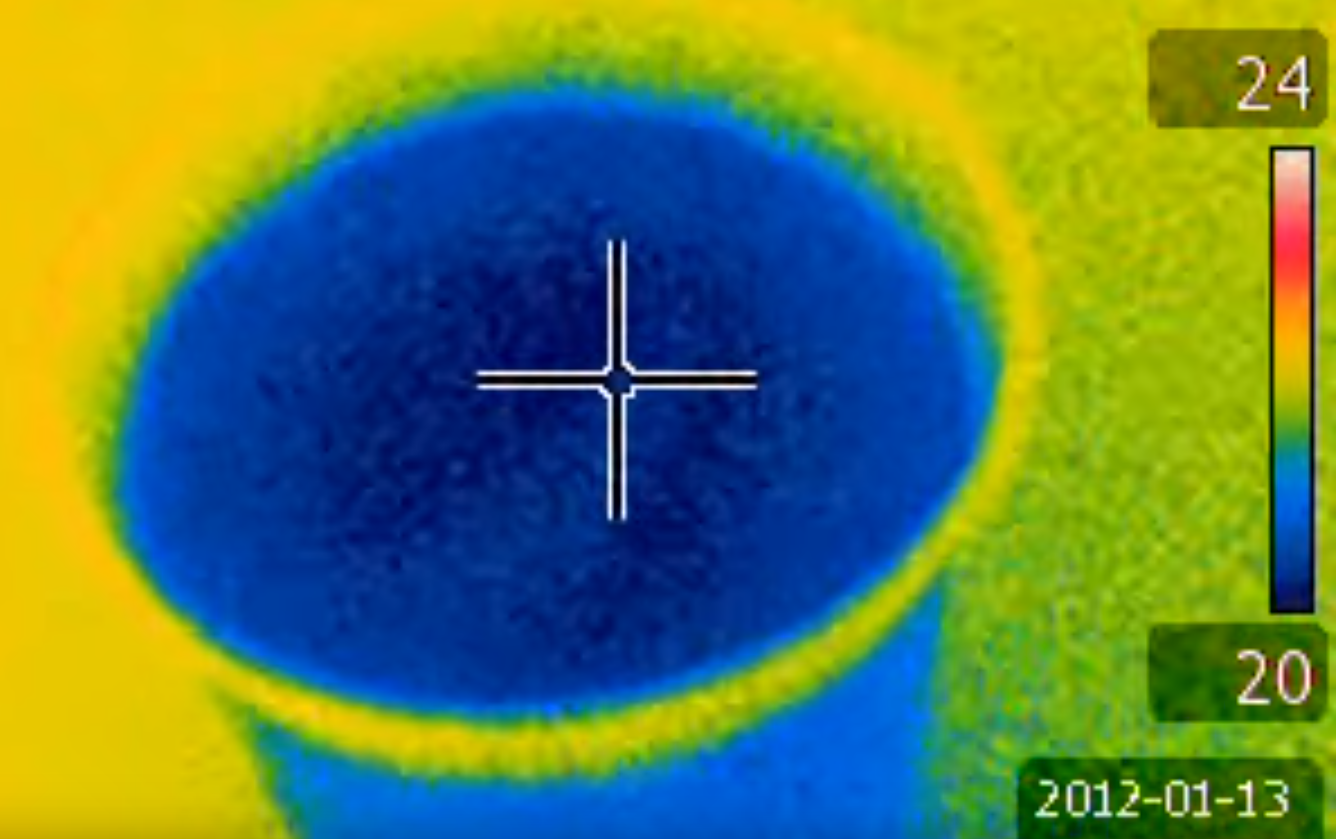
Figure 2: IR imaging
Most IR cameras are sensitive enough to pick up a temperature difference of 0.1°C or less. This sensitivity makes it possible to detect certain effects from the molecular world. Figure 1 provides an example that suggests this possibility.

This experiment, which concerns evaporation of water, cannot be simpler: Just pour some room-temperature water into a plastic cup, leave it for a few hours, and then aim an IR camera at it. In stark contrast to the thermal background, the whole cup remains 1-2°C cooler than the room temperature (Figure 2). About how much water evaporation is enough to keep the cup this cool? Let’s do a simple calculation. Our measurement showed that in a typical dry and warm office environment in the winter, a cup of water (10 cm diameter) loses approximately six grams of water in 24 hours. That is to say, the evaporation rate is 7×10⁻⁵ g/s or 7×10-11 m3/s. Divided by the surface area of the cup mouth, which is 0.00785 m2, we obtain that the thickness of the layer of water that evaporates in a second is 8.9 nm—that is roughly the length of only 30 water molecules lining up shoulder to shoulder! It is amazing to notice that just the evaporation of this tiny amount of water at such a slow rate (a second is a very long time for molecules) suffices to sustain a temperature difference of 1-2°C for the entire cup. 

This simple experiment actually raises more questions than it answers. Based on the latent heat of vaporization of water, which is about 2265 J/g, we estimate that the rate of energy loss through evaporation is only 0.16 J/s. This rate of energy loss should have a negligible effect on the 200 g of water in the cup as the specific heat of water is 4.186 J/(g×°C). So where does this cooling effect come from? How does it persist? Would the temperature of water be even lower if there is less water in the cup? What would the temperature difference be if the room temperature changes? These questions pose great opportunities to engage students to propose their hypotheses and test them with more experiments. It is through the quest to the answers that students learn to think and act like scientists.

IR imaging is an ideal tool for guided inquiry as it eliminates the tedious data collection procedures and focuses students on data analysis. In the practice of inquiry, data analysis is viewed as more important than data collection in helping students develop their thinking skills and conceptual understandings. Although this cooling effect can also be investigated using a thermometer, students’ perception might be quite different. An IR camera immediately shows that the entire cup, not just the water surface, is cooler. Seeing the bulk of the cup in blue color may prompt students to think more deeply and invite new questions, whereas a single temperature reading from a thermometer may not deliver the same experience.

Saturday, December 12, 2015

Scientists use Energy2D to simulate the effect of micro flow on molecular self-assembly

Copyright: ACS Nano, American Chemical Society
Self-assembled peptide nanostructures have unique properties that lead to applications in electrical devices and functional molecular recognition. Exactly how to control the self-assembly process in a solution is a hot research topic. Since a solution is a fluid, a little fluid mechanics would be needed to understand how micro flow affects the self-assembly of the peptide molecules.

ACS Nano, a journal of the American Chemical Society, published a research article on December 11 that includes a result of using our Energy2D software to simulate turbulent situations in which the non-uniform plumes rising from the substrate result in the formation of randomly arranged diphenylalanine (FF) rods and tubes. This paper, titled "Morphology and Pattern Control of Diphenylalanine Self-Assembly via Evaporative Dewetting," is the result of collaboration between scientists from Nanjing University and the City University of Hong Kong.

We are absolutely thrilled by the fact that many scientists have used Energy2D in their work. As far as we know, this is the second published scientific research paper that has used Energy2D.

On a separate avenue, many engineers are already using Energy2D to aid their design work. For example, in a German forum about renewable energy, an engineer has recently used the tool to make sense of his experimental results with various air collector designs. He reported that the results are "confirmed by the experiences of several users: pressure losses and less volume of air in the blowing operation" (translated from German using Google Translate).

It is these successful applications of Energy2D in the real world that will make it a relevant tool in science and engineering for a very long time.