Thursday, May 26, 2016


Friday, May 20, 2016
3D model of Ulm Minster created in just one day using Energy3D

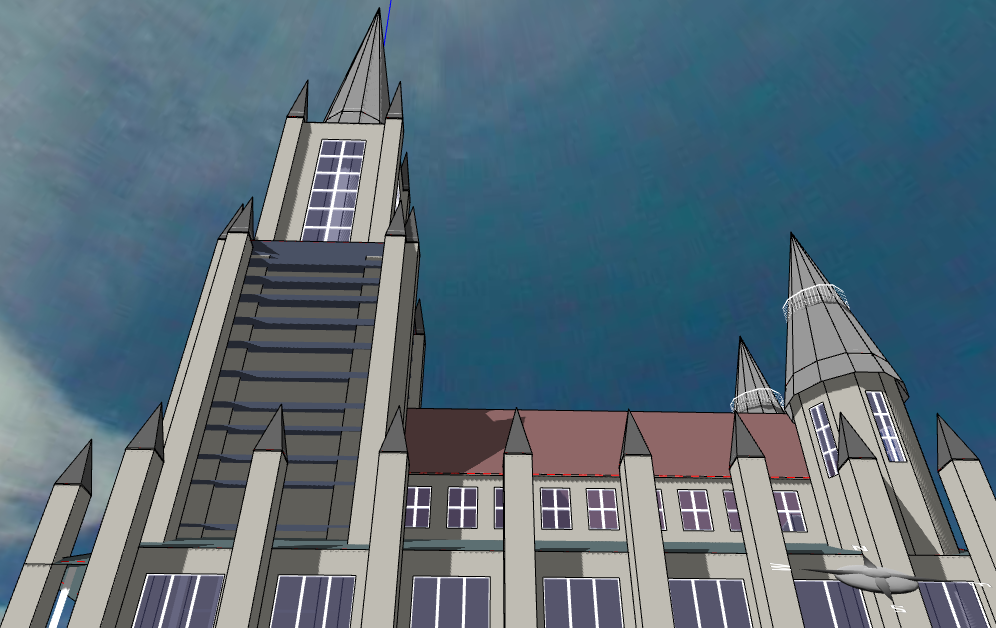
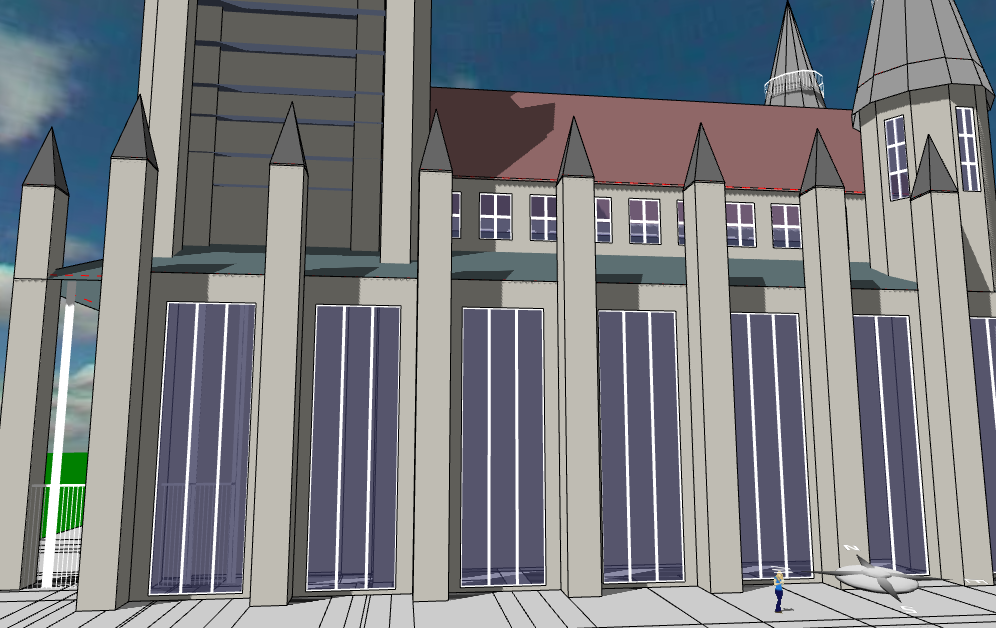
 Guanhua Chen, a graduate student from the University of Miami in Florida who joined my team this week as a summer intern, created an unbelievably detailed model of Ulm Minster -- in JUST ONE DAY. In total, his model has 373 elements.
 Considering that he is very new to Energy3D (though he previously had some experiences with Maya and Unity3D), this somehow indicates just how easy Energy3D may be for 3D modeling, especially for novices. (As a matter of fact, I must confess that we cheated a bit because, as he was working on it, I rushed to add new features to the software on the fly to address his complaints. Then he just restarted the program and got onto a more performant version).
 This capability will be extremely useful for engineering design, which must address both structure and function and their relationship. Being able to create complex structures rapidly and then study their functions based on the building simulation and solar simulation engines of Energy3D allows users to explore many design options and test them immediately, a feature that is critically important to engineering education.


Wednesday, May 18, 2016
Energy3D makes designing realistic buildings easy

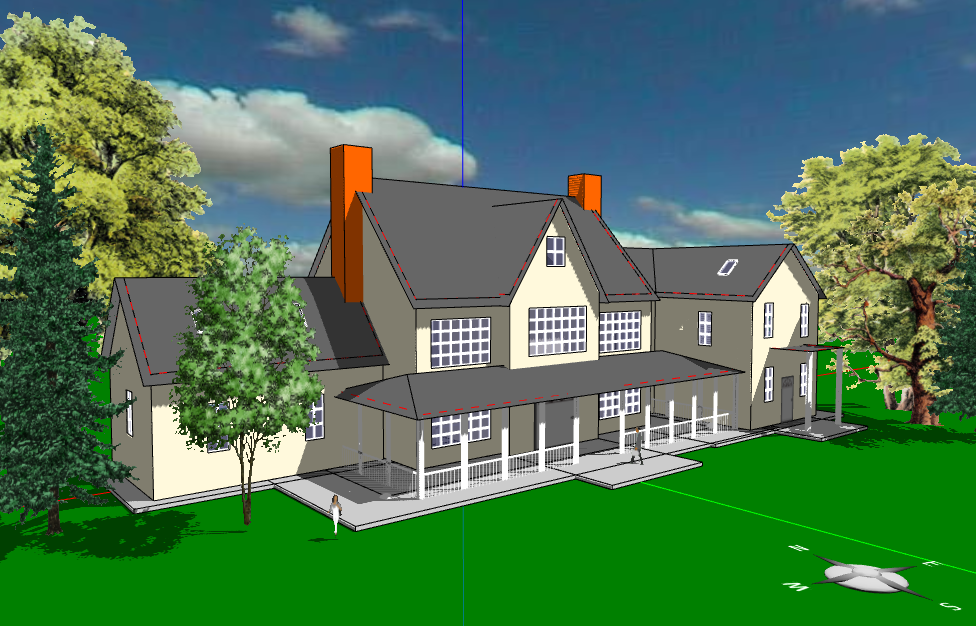

Another way to conduct accurate scientific analysis of solar panel outputs based on their layout on the rooftop is to use a computer-aided engineering (CAE) tool to do a three-dimensional, full-year analysis based on ab initio scientific simulation. Under the support of the National Science Foundation since 2010, we have been developing Energy3D, a piece of CAE software that has the goal of bringing the power of sophisticated scientific and engineering simulations to children and laypersons. To achieve this goal, a key step is to support users to rapidly sketch up their own buildings and the surrounding objects that may affect their solar potentials. We feel that most CAD tools out there are probably too difficult for average users to create realistic models of their own houses. This forces us to invent new solutions.
 We have recently added countless new features to Energy3D to progress towards this goal. The latest version allows many common architectural styles found in most parts of the US to be created and their solar potential to be studied. The screenshots embedded in this article demonstrate this capability. With the current version, each of these designs took myself approximately an hour to create from scratch. But we will continue to push the limit.
The 3D construction user interface has been developed based on the tenet of supporting users to create any structure using a minimum set of building blocks and operations. Once users master a relatively small set of rules, they are empowered to create almost any shape of building as they wish.
 |
| Solar yield analysis of the first house |
Google's 3D map may provide a way to extract these data. Once the approximate geometry of a building is determined, users can easily put solar panels anywhere on the roof to check out their energy yield. They can then try as many different layouts as they wish to compare the yields and select an optimal layout. This is especially important for buildings that may have partial shades and sub-optimal orientations. CAE tools such as Energy3D can be used to do spatial and temporal analysis and report daily outputs of each panel in the array, allowing users to obtain fine-grained, detailed results and thus providing a good simulation of solar panels in day-to-day operation.
The engineering principles behind this solar design, assessment, and optimization process based on science is exactly what the Next Generation Science Standards require K-12 students in the US to learn and practice. So why not ask children for help to solarize their own homes, schools, and communities, at least virtually? The time for doing this can never be better. And we have paved the road for this vision by creating one of easiest 3D interfaces with compelling scientific visualizations that can potentially entice and engage a lot of students. It is time for us to test the idea.
To see more designs, visit this page.
Sunday, May 8, 2016
Making sense of non-optimal solar panel orientations seen on Google Map
 |
| Figure 1: Google Map |
While it might be a smart strategy to target houses with most promising returns at the beginning of the solar energy industry back a decade ago, the old rules may not hold any longer. With the solar cell efficiency of commercial panels climbing above 20% and, more importantly, the environmental awareness of homeowners increasing, the solar energy market has changed a lot.
Thanks to Google Map, it is just a few mouse clicks away to get an idea about the current status of the market. So I surveyed my neighborhoods in eastern Massachusetts and was surprised to find that a significant amount of rooftop solar panel arrays do not actually face south (Figure 1). This is understandable because a significant percentage of buildings do not have a roof that has a south-facing side. So if homeowners living in those houses want to contribute to solving the environmental problems, they do not have any other choice except putting solar panels wherever they can be mounted. If you take a look at your own neighborhood in Google Map, you should spot a lot of west- and east-facing (or even north-facing!) solar panels.
 |
| Figure 2. Solar simulation in Energy3D |
 |
| Figure 3: South-facing vs. west-facing |
Thanks to the funding from the National Science Foundation, this kind of estimation can be easily done using our Energy3D software, which has a decent crystal ball when it comes to solar modeling and prediction (Figure 2). I have been blogging about this capacity of the software for a while. It is time to finally put this tool into practice to help people evaluate their solar options.
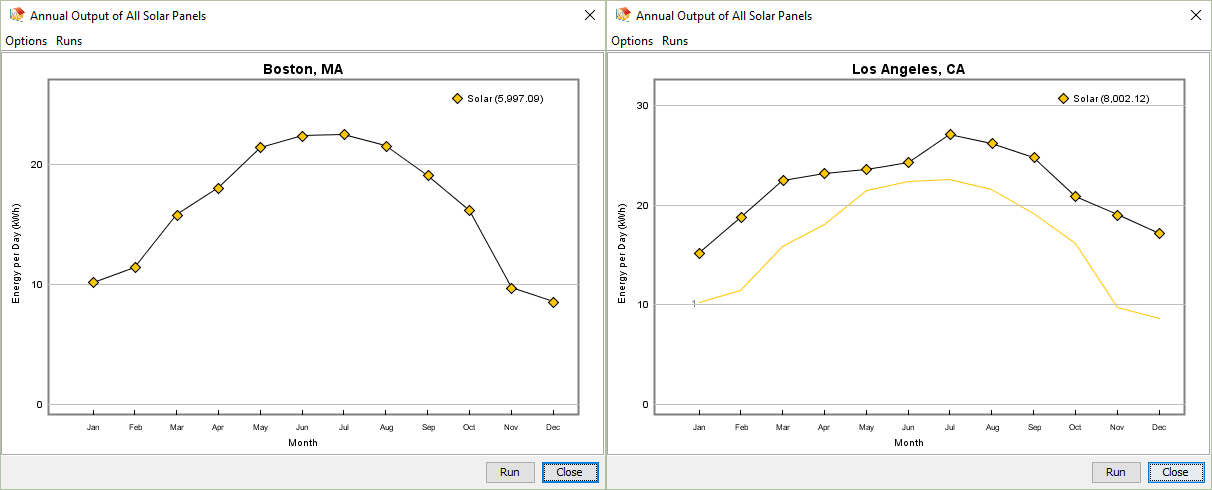
Let's start with a very simple house and a 5kW solar panel system (Figure 3). The first step is to get a sense of how accurate Energy3D's prediction may be. In situations similar to the standard test conditions (STC), this system -- when oriented to the south -- should generate about 6,000 kWh per year in Boston, Massachusetts and about 8,000 kWh per year in Los Angeles, California. The results from Energy3D agree exactly with these widely-cited numbers, as shown in Figure 4.
 |
| Figure 4: BOS vs. LAX |
 |
| Figure 5: South-facing vs. west-facing outputs |
The results of this study should give you a sense about how simulations may be useful in fostering the growth of the solar energy market. Even better, through years of development, we have made solar simulation in Energy3D so easy that anyone can do it. As an experimental step, we are now collaborating with high schools in Massachusetts to pilot-test the feasibility of engaging students to evaluate the solarization potential of their own houses. Our goal is to create an integrated education-business model that benefits both sides. We hope that the success of this project will help the world reach the goals set by the Paris Agreement.
Subscribe to:
Posts (Atom)