Saturday, December 31, 2016

Modeling the six MW solar farm at the Palmer Metropolitan Airfield in Massachusetts

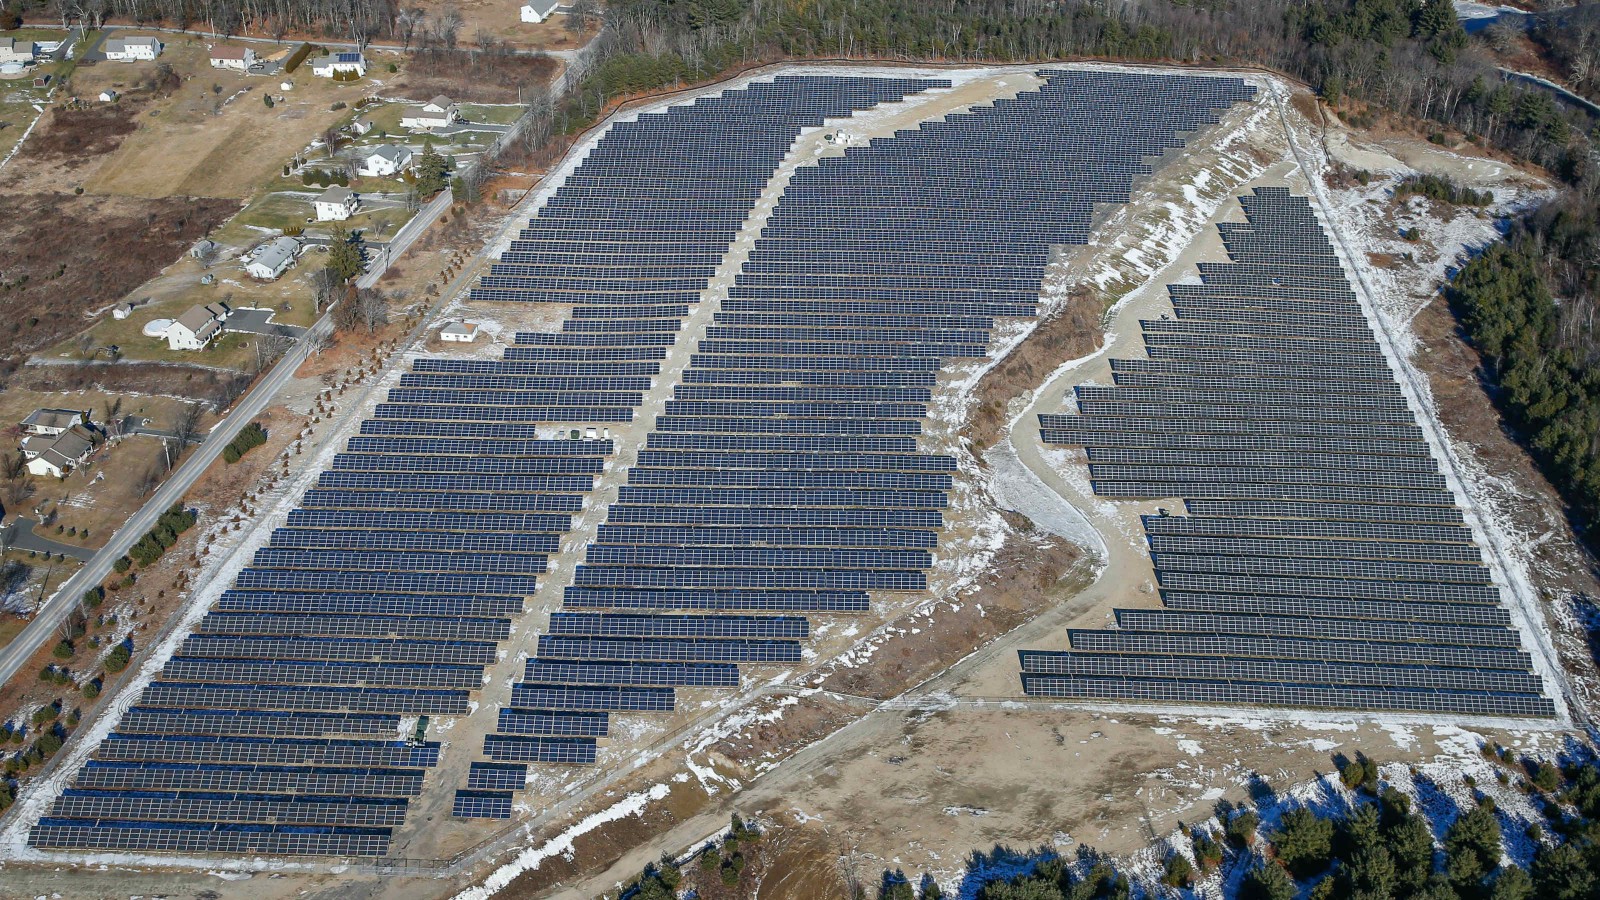
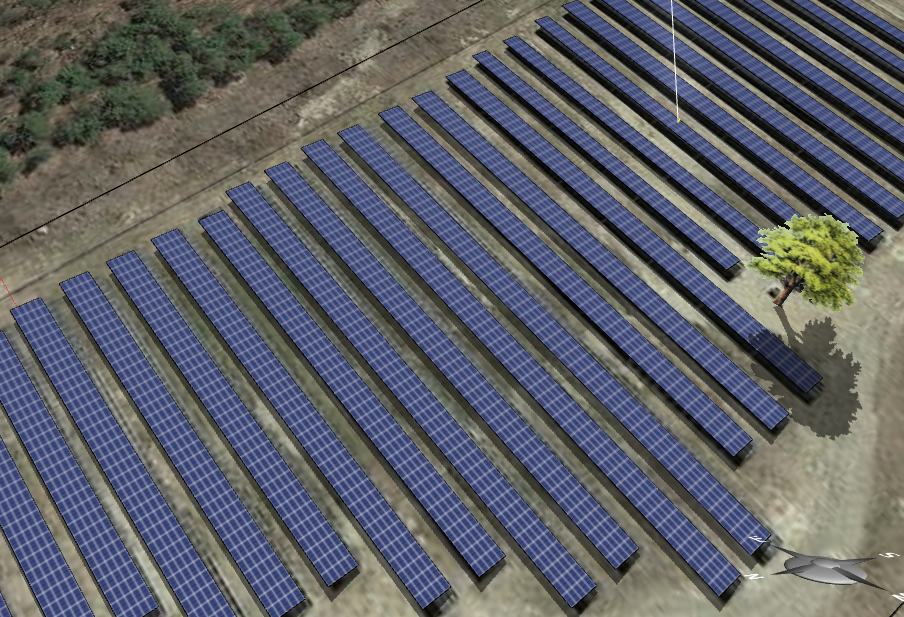
Fig. 1 Aerial view of PMA (courtesy of Borrego Solar)
Fig. 2 The polygon tool for drawing land parcels
The Palmer Metropolitan Airfield (PMA) solar farm (Figure 1) is the first and, at 6 MW, the largest Massachusetts Department of Energy Resources qualified brownfield project under the SREC II solar energy incentive program. The solar farm consists of 20,997 solar panels of three different types (5,161 Suniva, 13,851 Yingli, and 1,985 Canadian Solar), connected by 74 SMA string inverters. It is expected to produce an estimate of 8.5 GWh annually, enough to power 1,000 homes and offset 4,000 tons of carbon dioxide every year -- according to this news source. The PMA solar farm was engineered by our partner, Borrego Solar, the third largest company in the commercial solar market in the US.

Fig. 3 The Automatic Layout Wizard for solar rack arrays
The PMA solar farm is the first test of Energy3D's capacity of seriously designing utility-scale (greater than 1 or 5 MW, depending on your point of view) photovoltaic solar power plants. This design capacity was enabled by three critical new features that were added only recently to Energy3D (V6.2.2): 1) A tool to draw polygons that represent parcels of land for solar farms; 2) a tool to automatically generate solar panel and rack array layouts within selected parcels of land; and 3) accelerated graphical user interface and numerical simulation to handle 10,000+ solar panels (which I have blogged earlier this month).

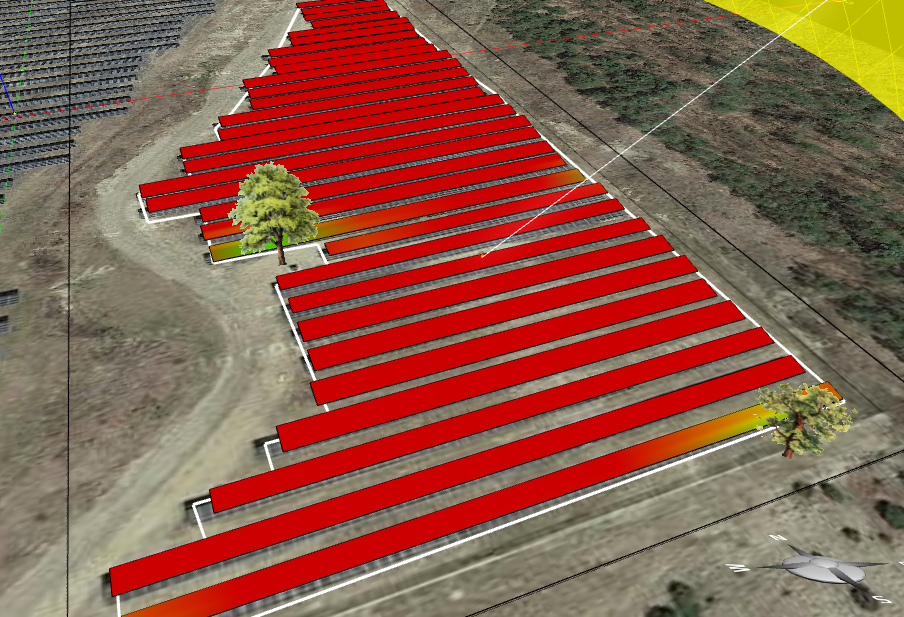
Fig. 4 The result of the Automatic Layout Wizard
Since Energy3D can import an Earth view image from Google Maps, you can directly draw polygons on top of the image to trace the parcel of land for designing your solar farm (Figure 2). Note that if you have multiple parcels of land that are separate from one another, you may have to use multiple foundations in Energy3D as each foundation is allowed to have one and only one polygon for the time being.

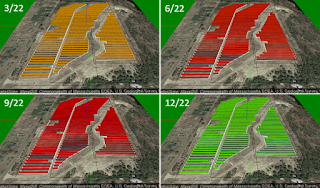
Fig. 5 Heat map representations of output in four seasons.
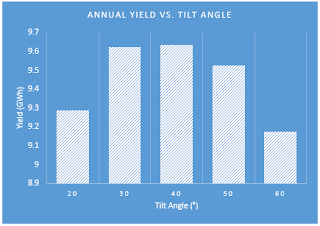
Fig. 6 Annual yield vs. tilt angle
As soon as you are all set with your land plans, you can use the Automatic Layout Wizard of Energy3D to add solar panel rack arrays (Figure 3). This wizard will automatically generate the array layout within the selected land parcel and assign properties to the solar panels based on the parameters of your choice. For instance, you can select how many rows of solar panels you want to have on each rack (I picked four because that is what Google Maps shows about the setting in PMA). Figure 4 shows the result of applying the Automatic Layout Wizard to populate the three subfields of the PMA solar farm.
Fig. 7 Monthly yields vs. tilt angle

After the layout is done, you can always revise the field. You can drag any rack to resize or move it, delete it, copy and paste it, or add a new rack. The Automatic Layout Wizard is not the only way to add solar panel arrays. It is just a super fast way to add thousands of solar panels at once -- without the wizard, it would have been too time-consuming to manually add solar panel racks one by one. The solar panel field is always editable after a layout is applied.

Let's now check how close our model is to reality. The total number of solar panels of our model is 21,064 -- only 67 more than that of the real PMA solar farm (I had no information about the exact types of solar panels deployed in PMA, so I guessed and selected two different sizes 0.99m x 1.65m and 0.99m x 1.96m for different subfields).

In terms of the annual output, Energy3D predicts approximately 9.6 GWh, about 12% higher than the estimated output of 8.5 GWh by Borrego Solar. I currently do not have access to the real operational data, though.

Having created a computer model allows us to experiment with it to study how to optimize the design. For example, we can easily change the tilt angles of the arrays and investigate how the annual yield is affected. Figure 6 shows that a tilt angle close to the latitude (42 degrees) seems to result in the highest overall annual output.

But the total annual output is not necessarily the only criterion. Sometimes, it is necessary for solar companies to consider load balancing to guarantee stable outputs throughout the year (assuming that we want to minimize the use of base load from burning fossil fuels). It is, therefore, interesting to also take a look at the outputs across 12 months of a year. Figure 7 suggests that a smaller tilt angle will produce peak power in the summer, whereas a larger tilt angle will produce peak power in early fall. If the demand of electricity in the summer is higher than that in the fall, it may be more lucrative to position solar panels at a lower tilt angle.

Ten research papers utilizing Energy2D published in the past two years

Screenshots from recent papers that use Energy2D
Energy2D simulation of fire
Energy2D is a multiphysics simulation program that was created from scratch and is still under development (though its progress has slowed down significantly because my priority has been given to its Energy3D cousin). The software was originally intended to be a teaching and learning tool for high school students who are interested in studying engineering. Over the past two years, however, we have seen 10 research papers published in various journals and conferences that involved significant applications of Energy2D as a scientific research tool for modeling natural phenomena and engineering systems. The problems that these researchers simulated range from solar energy, industrial processes, geophysics, and building science. The authors come from universities from all over the world, including top-notch institutions in US, Europe, and China.

Energy2D simulation of thermal bridge
Among them, researchers from Delft University of Technology, Technical University of Darmstadt, and Eindhoven University of Technology wrote in their recent paper about the validity of Energy2D: "The software program Energy2D is used to solve the dynamic Fourier heat transfer equations for the Convective Concrete case. Energy2D is a relatively new program (Xie, 2012) and is not yet widely used as a building performance simulation tool. To gain more confidence in the predictions with Energy2D, an analytical validation study was therefore carried out first, inspired by the approach described in Hensen and Nakhi (1994). Those analytical solutions and the simulation results of the dynamic response to a 20°C temperature step change on the surface of a concrete construction with the following properties were compared for this research." They concluded that "the simulation results never divert from the exact solution more than 0.45°C and it is therefore considered acceptable to further use this model."

The publication of these papers and very positive user feedback suggest that Energy2D seems to have found itself an interesting niche market. Many scientists and engineers are unable to invest a lot of time and money on its complicated commercial counterparts. But they nonetheless need a handy simulation tool that is much more flexible, intuitive, and capable than formulas in books to deal with realistic geometry -- at least in 2D. This is where Energy2D comes into play.

Reaching this milestone is critically important to the free and open-source Energy2D software, whose future will be reliant on community support. Its modest popularity among scientists is a valid demonstration of the broader impact expected by the National Science Foundation that funded its development. One can only imagine that there are many more users who used the software in their workplace but didn't publish. Now that good words about it have spread, we expect the usage to continue and even accelerate. To better support our users, we have added a community forum recently. We also plan to work with Professor Bob Hanson to port the Java code to JavaScript through his SwingJS translator so that the program can run on more devices.

The list of these papers is as follows:
  1. Mahfoud Abderrezek & Mohamed Fathi, Experimental Study of the Dust Effect on Photovoltaic Panels' Energy Yield, Solar Energy, Volume 142, pp 308-320, 2017
  2. Dennis de Witte, Marie L. de Klijn-Chevalerias, Roel C.G.M. Loonen, Jan L.M. Hensen, Ulrich Knaack, & Gregor Zimmermann, Convective Concrete: Additive Manufacturing to Facilitate Activation of Thermal Mass, Journal of Facade Design and Engineering, Volume 5, No. 1, 2017
  3. Javier G. Monroy & Javier Gonzalez-Jimenez, Gas Classification in Motion: An Experimental Analysis, Sensors and Actuators B: Chemical, Volume 240, pp 1205-1215, 2017
  4. Tom Rainforth, Tuan Anh Le, Jan-Willem van de Meent, Michael A. Osborne, & Frank Wood, Bayesian Optimization for Probabilistic Programs, 30th Conference on Neural Information Processing Systems, Barcelona, Spain, 2016
  5. E. Rozos, I. Tsoukalas, & C. Makropoulos, Turning Black into Green: Ecosystem Services from Treated Wastewater, 13th IWA Specialized Conference on Small Water and Wastewater Systems, Athens, Greece, 2016
  6. W. Taylor Shoulders, Richard Locke, & Romain M. Gaume, Elastic Airtight Container for the Compaction of Air-Sensitive Materials, Review of Scientific Instruments, Volume 87, 063908, 2016
  7. Zachary R. Adam, Temperature Oscillations near Natural Nuclear Reactor Cores and the Potential for Prebiotic Oligomer Synthesis, Origins of Life and Evolution of Biospheres, Volume 46, Issue 2, pp 171-187, 2016
  8. Jiarui Chen, Shuyu Qin, Xinglong Wu, & Paul K Chu, Morphology and Pattern Control of Diphenylalanine Self-Assembly via Evaporative Dewetting, ACS Nano, Volume 10, No. 1, pp 832-838, 2016
  9. Atanas Vasilev, Geothermal Evolution of Gas Hydrate Deposits: Bulgarian Exclusive Economic Zone in the Black Sea, Comptes rendus de l‘Académie bulgare des Sciences, Volume 68, No. 9, pp 1135-1144, 2015
  10. Pedro A. Hernández, et al., Magma Emission Rates from Shallow Submarine Eruptions Using Airborne Thermal Imaging, Remote Sensing of Environment, Volume 154, pp 219-225, November 2014

Saturday, December 17, 2016

Accelerating solar farm design in Energy3D with a new model of solar panel racks

Fig. 1: A solar farm of 5,672 solar panels on 8/16 in Boston
The solar simulation in Energy3D is based on discretizing a solar panel, a reflector, a solar water heater, a window, or any other surface into many small cells (mesh), calculating the solar radiation to the centers of the cells, and then summing the results up to obtain the total energy output. For example, a photovoltaic solar panel can be divided into 6x10 cells (this is also because many residential versions of solar panels are actually designed to have 6x10 solar cells). The simulation runs speedily when we have only a few dozen solar panels such is in the case of rooftop solar systems.

Fig. 2: Simulation of 5,672 solar panels on 8/16 in Boston
Unlike rooftop solar systems, large-scale solar farms typically involve thousands of solar panels (mega utility-scale solar farms may have hundreds of thousands of solar panels). If we use the same discretization method for each panel, the simulation would run very slowly (e.g., the speed drops to 1% when the number of solar panels are 100 times more). This slowdown basically makes Energy3D impractical to use by those who cannot afford to wait such as students in the classroom who need to get the results quickly.

Fig. 3: The result of the accelerated model
Fig. 4: The result of the original model
Luckily, solar panel arrays are often installed on parallel long racks in many solar farms (Figure 1). For such solar panel arrays, a lot of calculations could be spared without compromising the overall accuracy of the simulation too much. This allows us to develop a more efficient model of numeric simulation to do solar radiation calculation and even explore methods that use non-uniform meshes to better account for areas that are more likely to be shaded, such as the lower parts of the solar panel arrays. By implementing this new model, we have succeeded in speeding up the calculation dramatically. For example, the daily solar simulation of a solar farm consisting of more than 5,000 solar panels took about a second on my Surface Book computer (Figure 2 -- in this scene I deliberately added a couple of trees so that you can see the result of shading). With the previous model I would probably have to wait for hours to see the result and the graphics card of my computer would take a very deep breath to render more than 5,000 dynamic textures. This is a huge improvement.

Figures 3 and 4 show a comparison of the simulation results between the new and old models. Quantitatively, the total output of the new model is 93.63 kWh for the selected day of June 22 in Boston, compared with 93.25 kWh from the original model. Qualitatively, the color shading patterns that represent the distribution of solar radiation in the two cases are also similar.

The new rack model supports everything about solar panels. It has a smart user interface that allows the user to draw racks of any size and in any direction -- it automatically trims off any extra length so that you will never see a partial solar panel on a rack. When tracking systems are used with long, linear racks, there is only one way to do it -- horizontal single-axis tracker (HSAT). The new model can handle HSAT with the same degree of speed-up. For other trackers such as the vertical single-axis tracker (VSAT) or the altazimuth dual-axis trackers (AADAT), the speed-up will not be as significant, however, as the inter-rack shading is more dynamically complex and each rack must be treated independently.