To design a solar panel array, we need to understand the specifications of the type of solar panel that we are going to use (here is
an example of the specs of SunPower's X21-series). Although all solar panels provide nominal maximum power outputs (Pmax or Pnom), those numbers specify the DC power outputs under the
Standard Test Conditions (STC) or
PVUSA Test Conditions (PTC). Those numbers only provide some standardized values for customers' reference and cannot be used to calculate the electricity generation in the real world. Although each brand of solar panel may be designed in different ways and the specs vary, there
are a few scientific principles that govern most of them. The calculation of power generation can therefore be drawn upon these fundamental principles. This article covers some of these principles.
The first parameter for solar power calculation is the
solar cell efficiency, which defines the percentage of incident sunlight that can be converted into electricity by a cell of the solar panel. This property is usually determined by the semiconductor materials used to make the cell. Monocrystalline silicon-based materials tend to have a higher efficiency than polycrystalline ones. As of 2017, the solar cell efficiency for most solar panels in the market typically ranges from 15% to 25%. The higher the efficiency, the more expensive the solar panel.
 |
| Figure 1: All cells in a series (left) and diode bypasses (right) |
The solar cell efficiency generally decreases when the temperature increases. To reflect this relationship, solar panels usually specify the
Nominal Operating Cell Temperature (NOCT) and the
Temperature Coefficient of Pmax. The former describes how high the temperature of the cell rises to under the sun. The latter describes how much the solar cell efficiency drops as the cell temperature rises. If we know the solar cell efficiency under STC, the NOCT, the Temperature Coefficient of Pmax, the air temperature, and the solar radiation density on the surface of the cell, we can compute the actual efficiency of the solar cell at current time.
Now, in order to compute the actual power output of the cell, we will need to know two more things: the area of the cell and the angle between the surface of the cell and the direction of the sun. The area of the cell is related to
the packing density of the cells on a solar panel. Polycrystalline solar cells can have nearly 100% of packing density as they are usually rectangular, whereas monocrystalline ones have less packing density as they usually have round corners (therefore, they can't use up the entire surface area of a solar panel). The angle between the cell and the sun depends on how the solar panel is installed. This usually comes down to its tilt angle and azimuth.
 |
| Figure 2: Landscape vs. portrait (diode bypasses, location: Boston) |
All these parameters are needed in Energy3D's solar radiation simulation. As a user, what you have to do is to understand the meaning of these parameters while designing your solutions and set the parameters correctly for your simulations. As Energy3D hasn't provided a way to select a solar panel model and then automatically import all of its specs, you still have to define a solar panel brand by setting its properties manually.
The next thing we must consider is a little tricky. A solar panel is made of many cells, arranged in an array of, for example 6
× 10. In order for the cells to produce usable voltage, they are usually connected in a series (the left image in Figure 1). In this case, the electric current flowing through each cell is the same but the voltage adds up. However, the problem with a series circuit is that, if one cell gets shaded by, say, a leaf that falls on it, and as a result generates a weaker current, every other cell of the panel will end up generating a smaller output (worse, all the generated electricity that cannot flow freely will turn into heat and damage the cells). To mitigate this problem, most solar panels today use diode bypasses (the right image in Figure 1) or similar technologies to allow the part of the solar panel that is not shaded to be able to contribute to the overall output. However, if the shade is not as spotty as is in the case of a leaf, even the diode bypasses will not be able to prevent complete loss (
this video nicely demonstrates the problem). Therefore, our design of solar arrays must consider the actual wiring of the solar cells on the solar panel that we choose.
 |
| Figure 3: Month-by-month outputs of four arrays in Figure 2. |
What are the implications of the cell wiring? Figure 2 shows four solar panel arrays with two different inter-row distances but the same number of identical solar panels that connect their cells with diode bypasses. The size of each solar panel is about 1 meter
× 2 meters. On the racks of two arrays, the solar panels are placed in the landscape orientation -- each rack has therefore four rows of solar panels. On the racks of the other two arrays, they are placed in the portrait orientation -- each rack has therefore two rows of solar panels. When the inter-row spacing between two adjacent racks is the same, our simulation suggests that the landscape array always generates more electricity than the portrait array. This difference demonstrates the effect of the cell wiring using diode bypasses. In the front part of Figure 2 for arrays with narrower inter-row spacing, the simulation shows that about a quarter of the area on the racks after the first one is shaded during the course of the day (as indicated by their blue coloring). When the solar panels at the bottom of a rack is shaded, a portrait orientation reduces the output of 50% of the solar panels (there are two rows of solar panels on each rack in the portrait array shown in Figure 2), while a landscape orientation reduces the output of 25% of the solar panels (there are four rows of solar panels on each rack in the landscape array shown in Figure 2). The difference becomes less when the inter-row distance is longer. So when you have a limited space to place your solar arrays, you should probably favor the landscape orientation.
 |
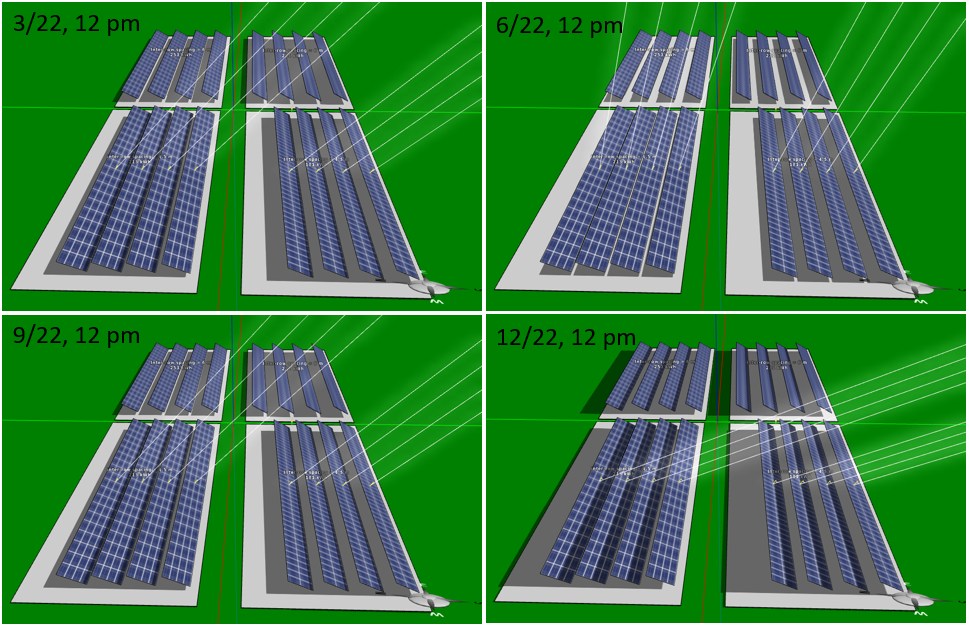
| Figure 4: Shadow analysis shows inter-row shading in four seasons. |
Of course, the output of a solar array depends also on the season. When the sun is high in the sky in the summer, the inter-row shading becomes less a problem. It is during the winter months when the shading loss becomes significant. This is shown in Figure 3. A snapshot of the shadow analysis (Figure 4) illustrates the difference visually.
For sites in the snowy north, another factor in the winter that favors the landscape orientation is the effect of snow accumulation on the panels. As soon as snow slides off the upper third of a solar panel in the landscape arrangement, it will start to generate some electricity. In the case of the portrait arrangement, it has to wait until all the snow comes off the panel.
Note that this article is concerned only with the cell wiring on a solar panel. The wiring of solar panels in an array is another important topic that we will cover later.


No comments:
Post a Comment