 |
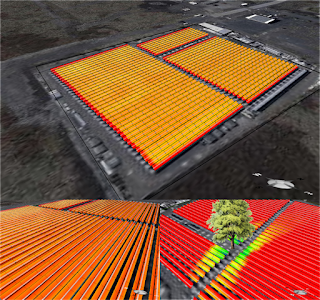
| Fig. 1: 3D heat map of the Keahole Plant in Hawaii |
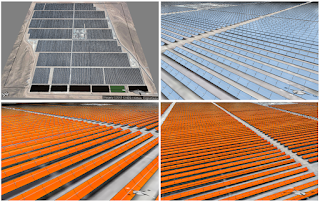 |
| Fig. 2: SEGS-8 in California and NOOR-1 in Morocco |
In Version 7.1.7 of
Energy3D, I have added the basic functionality needed to perform simulation-based analysis of solar power plants using parabolic trough arrays. These tools include 24-hour yield analysis for any selected day, 12-month annual yield analysis, and the 3D heat map visualization of the solar field for daily shading analysis (Figure 1). The heat map representation makes it easy to examine where and how the design can be optimized at a fine-grained level. For instance, the heat map in Figure 1 illustrates some degree of inter-row shadowing in the densely-packed
Keahole Solar Power Plant in Hawaii (also known as Holaniku). If you are curious, you can also add a tree in the middle of the array to check out its effect (most solar power plants are in open space with no external obstruction to sunlight, so this is just for pure experimental fun).
 |
| Fig. 3: Hourly outputs near Tuscon in four seasons |
 |
| Fig. 4: Hourly outputs near Calgary in four seasons |
As of July 12, I have constructed the Energy3D models for
nine such solar power plants in Canada, India, Italy, Morocco, and the United States (Arizona, California, Florida, Hawaii, and Nevada) using the newly-built user interface for creating and editing large-scale parabolic trough arrays (Figure 2). This interface aims to support anyone, be she a high school student or a professional engineer or a layperson interested in solar energy, to design this kind of solar power plant very quickly. The nine examples should sufficiently demonstrate Energy3D's capability of and relevance in designing realistic solar power plants of this type. More plants will be added in the future as we make progress in our
Solarize Your World Initiative that aims to engage everyone to explore, model, and design renewable energy solutions for a sustainable world.
 |
| Fig. 5: Hourly outputs near Honolulu in four seasons |
An interesting result is that
the output of parabolic troughs actually dips a bit at noon in some months of the year (Figure 3), especially at high altitudes and in the winter, such as Medicine Hat in Canada at a latitude of about 51 degrees (Figure 4). This is surprising as we perceive noon as the warmest time of the day. But this effect has been
observed in a real solar farm in Cary, North Carolina that uses horizontal single-axis trackers (HSATs) to turn photovoltaic solar panels. Although I don't currently have operation data from solar farms using parabolic troughs,
HSAT-driven photovoltaic solar arrays that align in the north-south axis work in a
way similar to parabolic troughs. So it is reasonable to expect that the outputs from parabolic troughs
should exhibit similar patterns. This also seems to agree with the graphs in Figure 6 of
a research paper by Italian scientists that compares parabolic troughs and Fresnel reflectors.
The effect is so counter-intuitive that folks call it "
Solar Array Surprises." It occurs only in solar farms driven by HSATs (fixed arrays do not show this effect). As both the sun and the solar collectors move in HSAT solar arrays, exactly how this happens may not be easy to imagine at once. Some people suggested that the temperature effect on solar cell efficiency might be a possible cause. Although it is true that the decrease of solar cell efficiency at noon when temperature rises to unfavorable levels in the summer of North Carolina can contribute to the dip, the theory cannot explain why the effect is also pronounced in other seasons. But Energy3D accurately predicts these surprises, as I have
written in an article about a year before when I added supports for solar trackers to Energy3D. I will think about this more carefully and provide the explanation later in an article dedicated to this particular topic. For now, I would like to point out that Energy3D shows that the effect diminishes for sites closer to the equator (Figure 5).


No comments:
Post a Comment