Wednesday, November 21, 2018

The SmartIR Gallery

Fig. 1: Thermal images in the Gallery
Gallery is a tool within the SmartIR app for users to manage their own thermal images, temperature graphs, and other data within the app. Unlike the default gallery in the operating system, SmartIR Gallery shows only things related to thermal imaging and provides image processing functions for analyzing thermal images and videos.

Fig. 2: Image processing in the Gallery
The gallery can be opened from the action bar of the SmartIR app. Once launched, it displays all the files that the user has collected through the app and stored on the device in a grid view (Figure 1). Tapping an image within the grid will display an enlarged view of the image in a popup window (by the way, the enlarged image in Figure 1 shows the liquid level of a propane tank revealed by the effect of cooling due to evaporation that feeds the gaseous fuel to the pipeline). Within the window, the user can swipe to the left or right, or tap the left or right arrow buttons, to browse the images.
Fig. 3: Temperature graphs in the Gallery

Based on OpenCV, SmartIR Gallery provides a number of image analysis tools for the user to quickly process thermal images. For instance, the user can blur, sharpen, invert, posterize, and adjust the brightness and contrast of an image (Figure 2). In the left image shown in Figure 2, sharpening a thermal image makes the view of the house more pronounced than the default view rendered by the FLIR ONE thermal camera. Inverting the thermal image, as shown in the middle image of Figure 2, may be a quick way to show how a heated house in the winter might look like in the opposite thermal condition such as an air-conditioned house in a hot summer day. In the right image shown in Figure 2, posterizing the thermal image creates an artistic view. More OpenCV tools will be added in the future to extend SmartIR's thermal vision capacity.

SmartIR Gallery also allows the user to filter the image files. For instance, the user can choose to show only the graphs, which are screenshot images taken from the temperature chart of SmartIR (Figure 3). Using the Share button, the user can easily send the displayed image to other apps such as an email app or a social network app.

Wednesday, September 19, 2018

A Small Step towards a Big Dream of Infrared Street View

The Infrared Street View is an award-winning project recognized by the U.S. Department of Energy and subsequently funded by the National Science Foundation. The idea is to create a thermal equivalent of Google's Street View that would serve as the starting point to develop a thermographic information system (i.e., the "Map of Temperature"). This is an ambitious goal that is normally only attainable through big investments from the Wall Street or by big companies like Google. However, as a single developer who doesn't have a lot of resources, I decided to give it a shot on my own. Being a non-Googler, I am counting on the citizen scientists out there to help me build the Infrared Street View. The first step is to create a free app so that they have a way to contribute.

My journey started in the mid of July 2018. In two months I have learned how to develop a powerful app from scratch. At the end, the Infrared Street View is coming into sight! This blog article shows some of the (imperfect but promising) results, as demonstrated in Figures 1 and 2.


Fig. 1: Panoramas in visible light and infrared light generated by SmartIR
This milestone is about developing the functionality in the SmartIR app for creating infrared panoramas so that anyone who has a smartphone with an infrared camera attachment such as FLIR ONE could produce a panoramic image and contribute it to the Infrared Street View, much like what you can do with Google's Street View app. Although this sounds easy at first glance, it has turned out to be quite challenging as we must work under the constraint of a very slow infrared thermal camera that can only take less than ten pictures per second. As our app targets average people who may be interested in science and technology, we must provide an easy-to-do user interface so that the majority of people can do the job without being overwhelmed. Lastly, to create virtual reality in infrared light, we must overcome the challenge of stitching the imperfect thermal images together to produce a seamless panoramic picture. Although they are many image stitchers out there, no one can be sure that they would be applicable to thermal images as those stitchers may have been optimized for only visible light images.

Fig. 2: Panoramas in visible light and infrared light (two coloring styles) generated by SmartIR
To support users to make 360° panoramas, SmartIR guides them to aim at the right angles so that the resulting image set can be used for stitching. These images should be evenly distributed in the azimuthal dimension and they should overlap considerably for the stitcher to have a clue about how to knit them together. SmartIR uses the on-board sensors of the smartphone to detect the orientation of the infrared camera. A number of circles are shown on the screen to indicate the orientations which the user should aim the cursor of the camera at. When the cursor is within the circle, an image is automatically taken and stored in a 360° scroller. By turning at a fixed position and aiming at the circles, the user can capture a series of images for stitching. The following YouTube videos show how this image collector works.


Although this is a very primitive prototype, it nonetheless represents the first concrete step towards the realization of the Infrared Street View. Down the road, stitchers for infrared thermal images still need significant improvements to truly achieve seamless effects similar to those for visible light images. Tremendous challenges for weaving the Map of Temperature still lie ahead. I will keep folks posted as I inch towards the goal and I am quite optimistic that I can get somewhere, even though I am not a Googler.

Sunday, September 9, 2018

Creating Augmented Reality Experiences in the Thermal World with SmartIR

Location-based augmented reality (AR) games such as Pokemon Go have become popular in recent years. What can we learn from them in order to make SmartIR into a fun science app? In the past week, I have been experimenting with AR in SmartIR using the location and orientation sensors of the smartphone. This article shows the limited progress I have achieved thus far. Although there are still tons of challenges ahead, AR appears to be a promising direction to explore further in the world of infrared thermal imaging.

According to Wikipedia, augmented reality is an interactive experience of a real-world environment whereby the objects in the real world are "augmented" by computed information. Typically, AR is implemented with a mobile device that has a camera and a display. In a broad sense, an image from a FLIR ONE thermal camera using the so-called MSX technology is automatically AR by default as it meshes a photo of the real world with false colors generated from the thermal radiation of the objects in the real world measured by the camera's microbolometer array. Similarly, the object-tracking work I have recently done for Project Snake Eyes can augment thermal images with information related to the recognized objects computed from their infrared radiation data, such as their silhouettes and their average temperatures.

Fig. 1: Very simple AR demos in SmartIR

But these are not the AR applications that I want to talk about in this article. The AR experience I hope to create is more similar to games like Pokemon Go, which is based on information geotagged by users and discovered by others. The involvement of users in creating AR content is critical to our app, as it aims to promote location-based observation, exploration, and sharing using thermal imaging around the world and aggregate large-scale thermal data for citizen science applications. Figure 1 shows the augmentation of the thermal image view with geotagged information for a house. If you are wondering about the usefulness of this feature other than its coolness (the so-what question), you can imagine tagging the weak points of a thermal envelope of a building during a home energy assessment. The following YouTube videos show how geotagging works in the current version of SmartIR and how users can later discover those geotags.


At this point of the development, I envision SmartIR to provide the following AR experiences. For users who have a thermal camera, a geotag can obviously guide them to find and observe something previously marked by others. What if you don't have a thermal camera but would still like to see how a place would look like through the lens of a thermal camera? In that case, a geotag allows you to see a plain thermal image or virtual reality (VR) view stored in the geotag, taken previously by someone else who had a thermal camera and overlaid in the direction of the current view on the screen of your phone. If VR is provided for the tagged site, the thermal image can also change when you turn your phone. Although nothing beats using a thermal camera to explore on your own, this is a "better than nothing" solution that mimics the experience of using one. In fact, this is the vision of our Infrared Street View project that aims at providing a thermal view of our world. In addition to the Web-based approach to exploring the Infrared Street View, AR provides a location-based approach that may be more intuitive and exciting.

Thursday, August 30, 2018

Adding Instructional Support in SmartIR

Fig. 1
A goal of the SmartIR app is to provide basic instructional support directly in the app so that students, citizen scientists, professionals, and other users can learn what they can do with the incredible power of thermal vision beyond its conventional applications. This requires a lot of development work, such as inventing the artificial intelligence that can guide them through making their own scientific discoveries and engineering decisions. While that kind of instructional power poses an enormous challenge to us, adding some instructional materials in the app so that users can get started is a smaller step that we can take right now.

As of August 30, 2018, I have added 17 experiments in physical sciences that people can do with thermal vision in SmartIR. These experiments, ranging from heat transfer to physical chemistry, are based on my own work in the field of infrared imaging in the past eight years and are all very easy to do (to the point that I call them "kitchen science"). I now finally have a way to deliver these experiments through a powerful app. Figure 1 shows the list of these experiments in SmartIR. Users can click each card to open the corresponding instructional unit (which is a sequence of steps that guide users through the selected set of experiments).

Fig. 2
To do better than just putting some HTML pages into the app, I have also built critical features that allow users to switch back and forth between the thermal view and the document view (Figure 2). When users jump to the thermal view from a document, a thumbnail view of that document is shown on top of a floating button in the thermal view window (see the left image in Figure 2), allowing users to click it and go back to the document at any time. The thumbnail also serves to remind them which experiment they are supposed to conduct. When they go back to the document, a thumbnail view of the thermal camera is shown on top of a floating button in the document view window (see the right image in Figure 2), allowing users to click it and go back to the thermal view at any time. This thumbnail view also connects to the image stream from the thermal camera so that users can see current picture the camera is displaying without leaving the document.

These instructional features will be further enhanced in the future. For instance, users will be able to insert a thermal image into a container, or even create a slide show, in an HTML page to document a finding. At the end, they will be able to use SmartIR to automatically generate a lab report.

These new features, along with what I have built in the past few weeks, mark the milestone of Version 0.0.2 of SmartIR (i.e., only 2% of the work has been done towards maturity). The following video offers a sneak peek of this humble version.


Wednesday, August 22, 2018

Project Snake Eyes: Automatic Feature Extraction Based on Thermal Vision

I am pleased to announce Project Snake Eyes. This ambitious project aims to combine image analysis and infrared imaging to create biomimetic thermal vision -- computer vision that simulates the ability of some animals such as snakes to see in darkness. One of the goals of Project Snake Eyes is to create probably the world's first robotic snake that can hunt through thermal sensing. Project Snake Eyes not only can detect heat, but it can also estimate the size and proximity of the source, giving the robotic snake the artificial intelligence to figure out whether or not it should strike the target. Through two weeks of intense research and development, I have come up with original algorithms that allow robust automatic feature extraction in real time from thermal images through a FLIR ONE camera. This article reports my progress thus far. The algorithms will be published in a journal in the field of image processing and computer vision later.


Figure 1 shows the detection of windows at night from outside a house. Half of the window was open at the time of observation. The lower temperature of the upper pane was partially due to the reflection of infrared light from the cooler environment such as the sky by the glass. The lower pane, which was the open part of the window, was due to the warmer inside of the house. As you can see, Project Snake Eyes approximately identified the shapes and sizes of the two panes, which stood out from the background because of their distinct temperatures. This ability will be used to develop advanced algorithms to automatically analyze the thermal signature of a building, paving the road to large-scale building thermal analyses through automation.

Figure 2 shows a more complex scenario using my computer desk as an example. As you can see, Project Snake Eyes automatically detected most of the hot spots (or cold spots, but I use hot spots to represent points of interest at either high or low temperature). Feature extraction such as blob detection through thermal vision could result in enhanced computer vision for technologies such as unmanned vehicles.

Figure 3 shows object reconstruction based on residue heat using my hand as an example. The residue heat that my hand left on the wall revealed its shape as six separate polygons (the largest one corresponds to the palm and the five smaller ones to the fingertips). Object reconstruction through residue heat could find its applications in certain industry monitoring and control.

Project Snake Eyes aims to identify and track objects.
Figure 4 shows object tracking using a colleague as an example. As you can see, Project Snake Eyes basically captured his body shape. The video clip that follows shows how this works in real time. The algorithms still need optimization to reduce the lag, but you get the basic idea of how object tracking using Project Snake Eyes works. Object tracking will be used to realize animal and human tracking in dark conditions for many science and engineering applications. For instance, we are collaborating with biologists in Texas to develop a system that can track bats at night in order to monitor the health of their colonies.

With all these excitements, I expect to carry on the research and development of Project Snake Eyes in the coming years. As a landmark step, we are working tirelessly towards the unveiling of the first prototype of the robotic snake with thermal vision, collaborating with two robotics teams led by Prof. Yan Gu at the University of Massachusetts Lowell and Prof. Zhenghui Sha at the University of Arkansas, respectively.

Stay tuned!

Thursday, August 2, 2018

Using SmartIR in Science Experiments

Fig. 1: The paper-on-cup experiment with SmartIR
SmartIR is a smartphone app that I am developing to support infrared (IR) thermal imaging applications, primarily in the field of science and engineering, based on the FLIR ONE SDK. The development officially kicked off in July 2018. By the end of the month, a rudimentary version, to which I assigned V 0.0.1 (representing approximately 1% of the work that needs to be done for a mature release), has been completed.

Fig. 2: Time graphs of temperatures in SmartIR
Although a very early version, SmartIR V0.0.1 can already support some scientific exploration. In this article, I share the results from doing the can't-be-simpler experiment that I did back in 2011 with a FLIR I5. This experiment needs only a cup of water, a piece of paper, and, of course, an IR camera (which is FLIR ONE Pro Generation 3 in my case). When a piece of paper is placed on top of an open cup of tap water that has sit in the room for a few hours, it warms up -- instead of cooling down -- as a result of the adsorption of water molecules onto the underside of the paper and the condensation of more water molecules to form a layer of liquid water, as shown in Figure 1.

While the user can observe this effect with any thermal camera, it is sometimes useful to also record the change of temperatures as time goes by. To do this, SmartIR allows the user to add any number of thermometers to the view (and move or delete them as needed) and show their temperature readings in a time graph on top of the thermal image view (this is sort of like the translucent sensor graph in my Energy2D computational fluid dynamics simulation program). Figure 2 shows the time graph of temperatures. To study the effect, I added three thermometers: one for measuring the ambient temperature (T3), one for measuring the temperature of water (T2), and one for measuring the temperature of the paper (T1). Note that, before the paper was placed, T1 and T2 both measured the temperature of the water in the cup. As today is pretty hot, T3 registered higher than 35 °C. Due to the effect of evaporative cooling, T2 registered about 33 °C. When a piece of paper was put on top of the cup, T1 rose to nearly 37 °C in a few seconds!

SmartIR is currently only available in Android. It hasn't been released in Google Play as intense development is expected to be under way in the next six months. A public release may be available next year.

Sunday, July 1, 2018

Artificial Intelligence Research: The Octopus Algorithm for Generating Goal-Directed Feedback

During the 2010 FIFA World Cup eight years ago, a common octopus named Paul the Octopus gained worldwide attention because it accurately "predicted" all the results of the most important soccer matches in the world (sadly it died by natural courses shortly after that). Perhaps Paul the Octopus just got extraordinarily lucky. Eight years later, as reported by the MIT Technology Review, artificial intelligence has been used in its stead to predict the World Cup (which I doubt would achieve the 100% success rate as the famous octopus did marvelously).

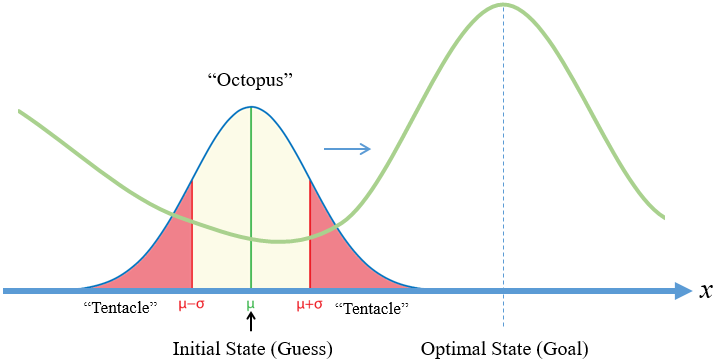
Fig. 1: An illustration of the Octopus Algorithm
While my research on artificial intelligence (AI) has nothing to do with predicting which team would win the World Cup this year, octopuses have become one of my inspirations in the past few days. My work is about developing AI techniques that support learning and teaching through solving vastly open-ended problems such as scientific inquiry and engineering design. One of the greatest challenges in such problem-solving tasks is about how to automatically generate formative feedback based on automatically assessing student work. Typically, the purpose of this kind of feedback is to gradually direct students to some kind of goals, for example, to achieve the most energy-efficient design of a building that meets all the specs. Formative feedback is critically important to ensuring the success of project-based learning. Based on my own experiences, however, many students have great difficulties making progress towards the goal in the short amount of time typically available in the classroom. Given the time constraints, they need help on an ongoing basis. But it is not realistic to expect the teacher to simultaneously monitor a few dozen students while they are working on their projects and provide timely feedback to each and every one of them. This is where AI can help. This is why we are developing new pedagogical principles and instructional strategies, hoping to harness the power of AI to spur students to think more deeply, explore more widely, and even design more creatively.

Fig. 2: Learning from AI through a competition-based strategy
Although this general idea of using AI in education makes sense, developing reliable algorithms that can automatically guide students to solve massively open-ended problems such as engineering design is by no means a small job. Through three months of intense work in this field, I have developed genetic algorithms that can be used to find optimal solutions in complex design environments such as the Energy3D CAD software, which you can find in earlier articles published through my blog. These algorithms were proven to be effective for optimizing certain engineering problems, but to call them AI, we will need to identify what kind of human intelligence they are able to augment or replace. In my current point of view, an apparent class of AI applications is about mimicking certain instructional capacities of peers and teachers. In order to create an artificial peer or even an artificial instructor, we would have to figure out the algorithms that simulate the constructive interactions between a student and a peer or between a student and an instructor.

Hence, an optimization algorithm that yields the best solution in a long single run is not very useful to developers and educators as it doesn't provide sufficient opportunities for engaging students. You can imagine that type of algorithm as someone who does something very fast but doesn't pause to explain to the learner how he or she does the job. To create a developmentally appropriate tool, we will need to slow down the process a bit -- sort of like the creeping of an octopus -- so that the learner can have a chance to observe, reflect, internalize, and catch up when AI is solving the problem step by step. This kind of algorithm is known as local search, a technique for finding an optimal solution in the vicinity of a starting point that represents the learner's current state (as opposed to global search that casts a wide net across the entire solution space, representing equally all possibilities regardless of the learner's current state). Random optimization is one of the local search methods proposed in 1965, which stochastically generates a set of candidate solutions distributed around the initial solution in accordance with the normal distribution. The graphical representation of a normal distribution is a bell curve that somewhat resembles the shape of an octopus (Figure 1). When using a genetic algorithm to implement the local search, the two red edge areas in Figure 1 can be imagined as the "tentacles" for the "octopus" to sense "food" (optima), while the green bulk area in the middle can be imagined as the "body" for it to "digest the catches" (i.e., to concentrate on local search). Once an optimum is "felt" (i.e., one or more solution points close to the optimum is included in the randomly generated population of the genetic algorithm), the "octopus" will move towards it (i.e., the best solution from the population will converge to the optimum) as driven by the genetic algorithm. The length of the "tentacles," characterized by the standard deviation of the normal distribution, dictates the pace in which the algorithm will find an optimum. The smaller the standard deviation, the slower the algorithm will locate an optimum. I call this particular combination of random optimization and genetic algorithm the Octopus Algorithm as it intuitively mimics how an octopus hunts on the sea floor (and, in part, to honor Paul the Octopus and to celebrate the 2018 World Cup Tournament). With a controlled drift speed, the Octopus Algorithm can be applied to incrementally correct the learner's work in a way that goes back and forth between human and computer, making it possible for us to devise a competition-based learning strategy as illustrated in Figure 2.

Although there are still a lot of technical details that need to be ironed out as we make progress, this competition-based strategy essentially represents an idea to turn a design process into some kind of adversarial gaming (e.g., chess or Go), which challenges students to race against a computer towards an agreed goal but with an unpredictable outcome (either the computer wins or the human wins). It is our hope that AI would ultimately serve as a tool to train students to design effectively just like what it has already done for training chess or Go players.

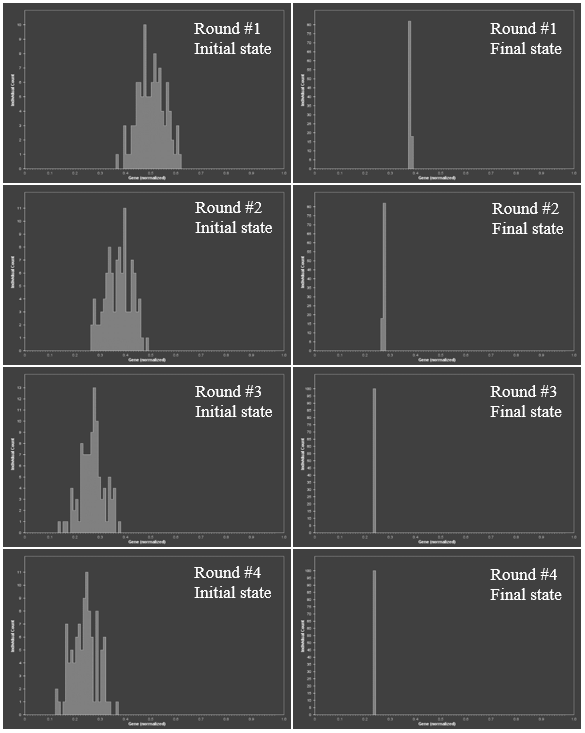
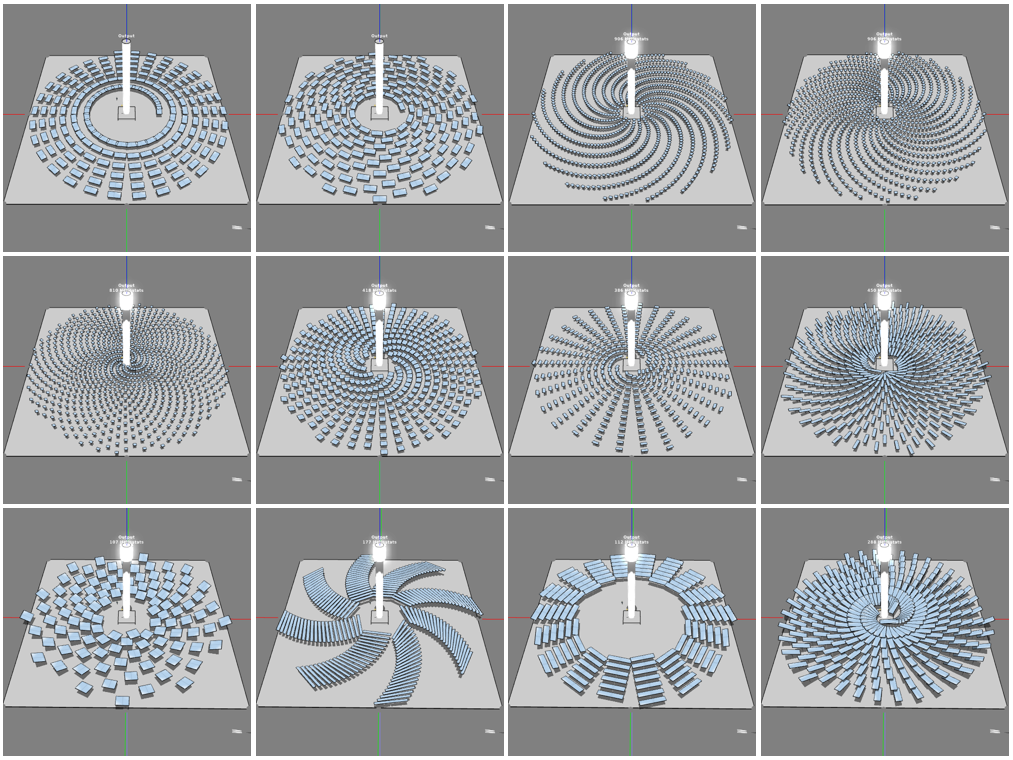
Fig. 3: Evolution of population in the Octopus Algorithm
How does the Octopus Algorithm work, I hear you are curious? I have tested it with some simple test functions such as certain sinusoidal functions (e.g., |sin(nx)|) and found that it worked for those test cases. But since I have the Energy3D platform, I can readily test 
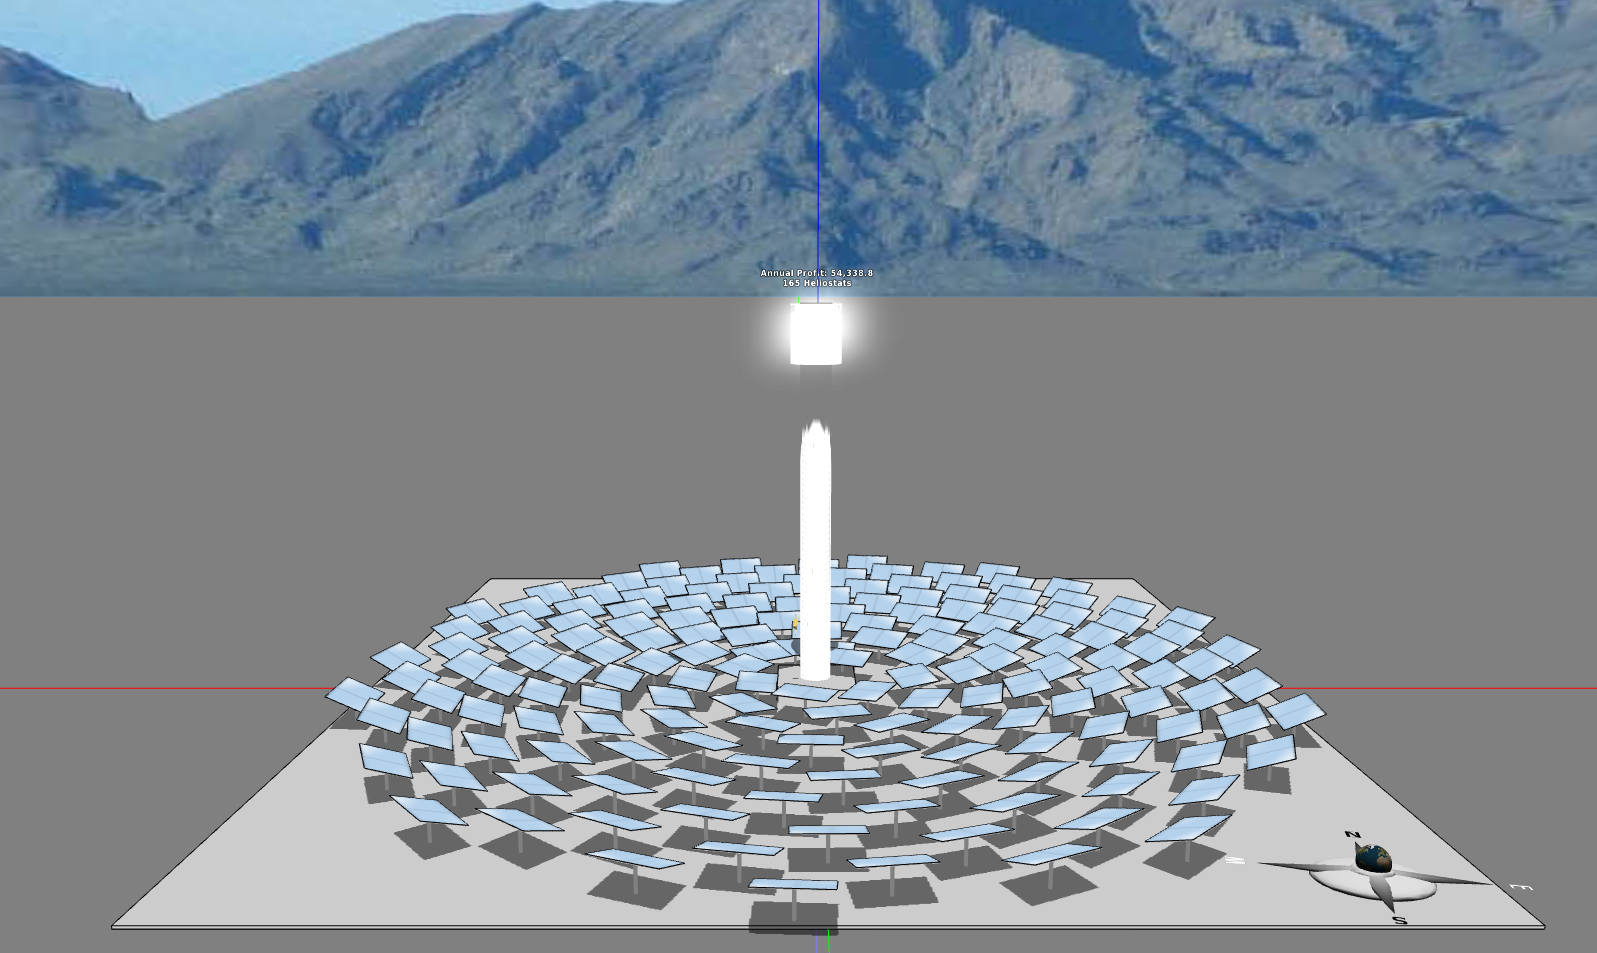
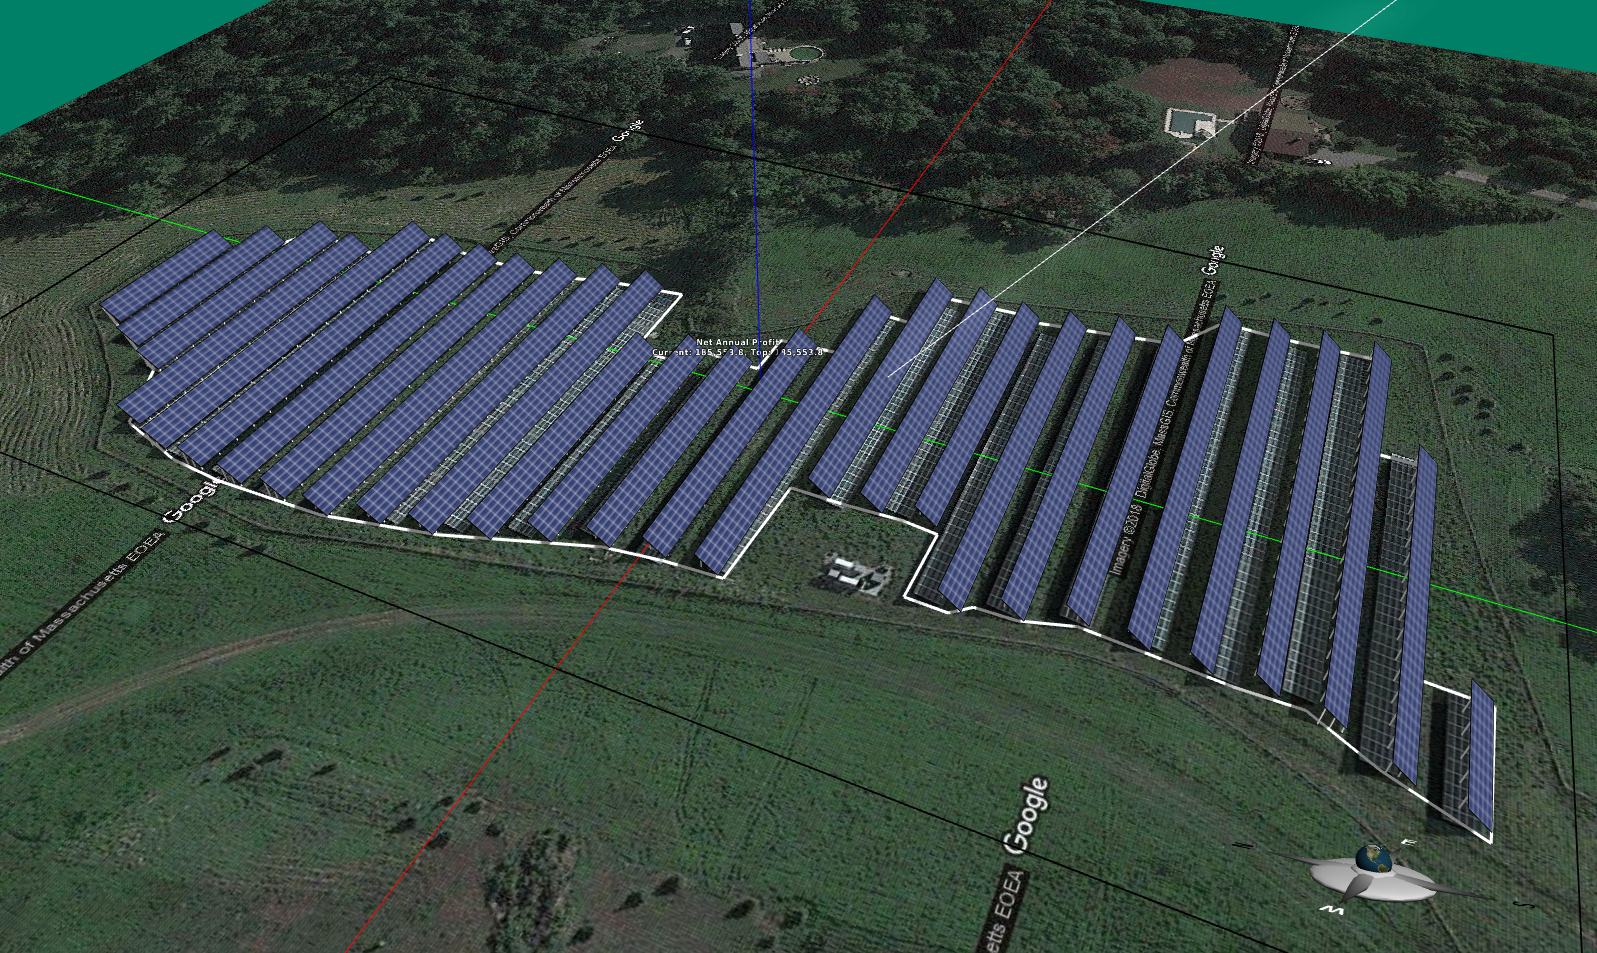
my algorithms with real-world problems instead of some toy problems. As the first real-world example, let's check how it finds the optimal tilt angle of a single row of solar panels for a selected day at a given location (we can do it for the entire year, but it takes much longer to run the simulation with not much more to add in terms of testing the algorithm). Let's assume that the initial guess for the tilt angle is zero degree (if you have no idea which way and how much the solar panels should be tilted, you may just lay them flat as a reasonable starting point). Figure 3 shows the results of four consecutive runs. The graphs in the left column show the normal distributions around the initial guess and the best emerged after each round (which was used as the initial guess for the next round). The graphs in the right column show the final distribution of the population at the end of each round. The first and second runs show that the "octopus" gradually drifted left. At the end of the third run, it had converged to the final solution. It just stayed there at the end of the fourth run.

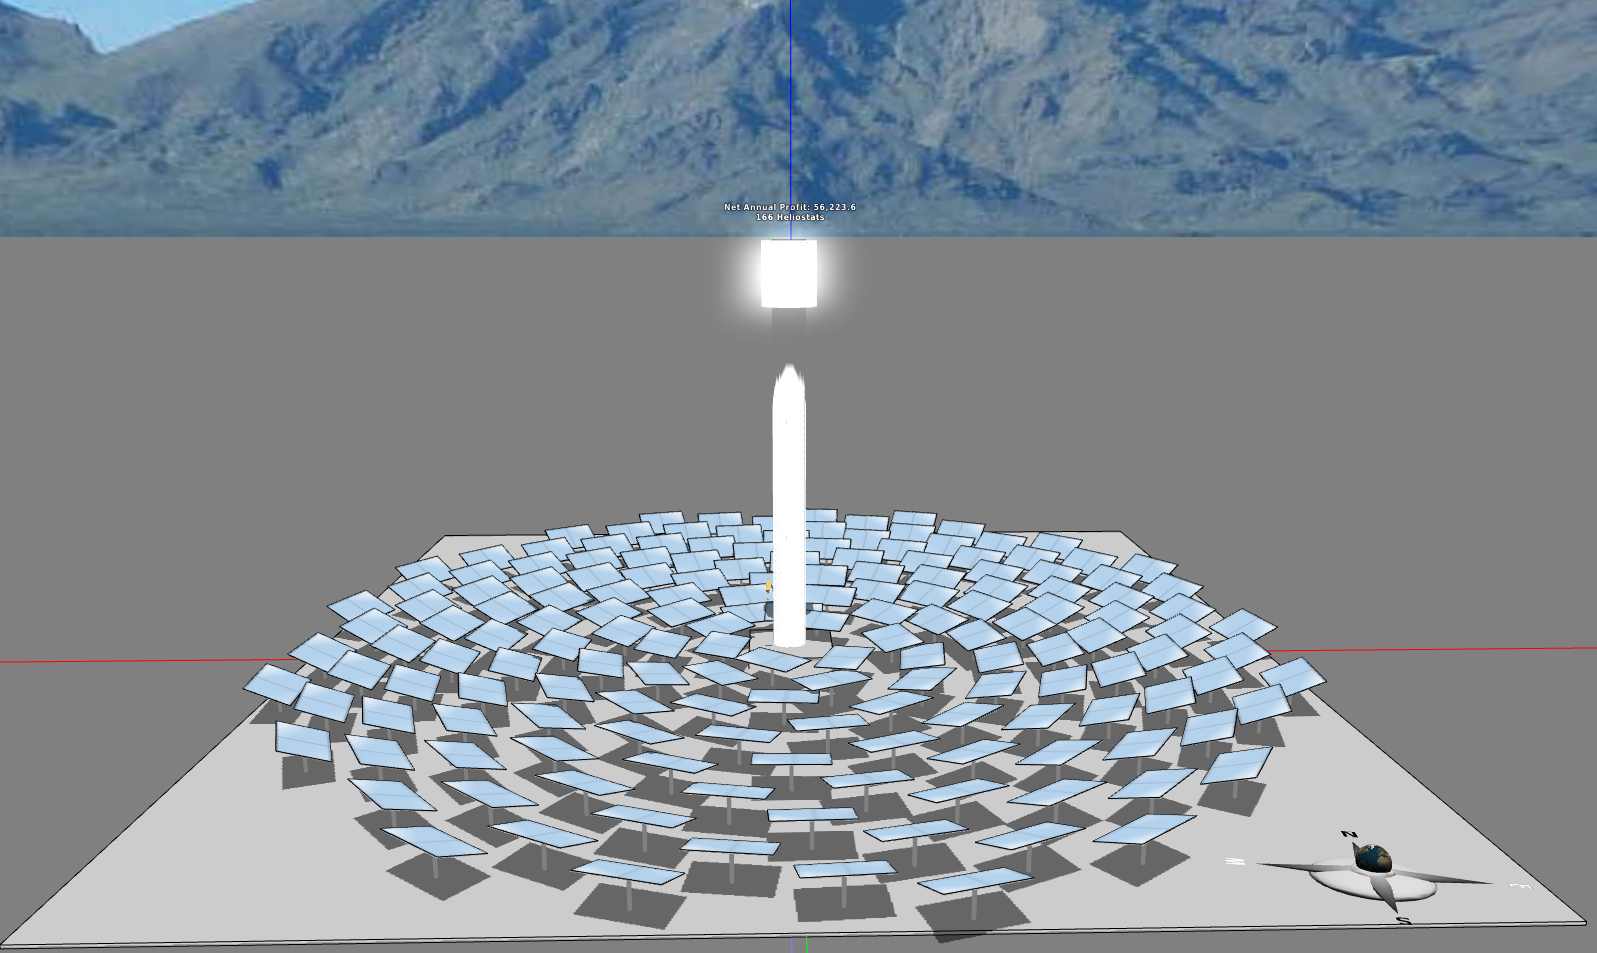
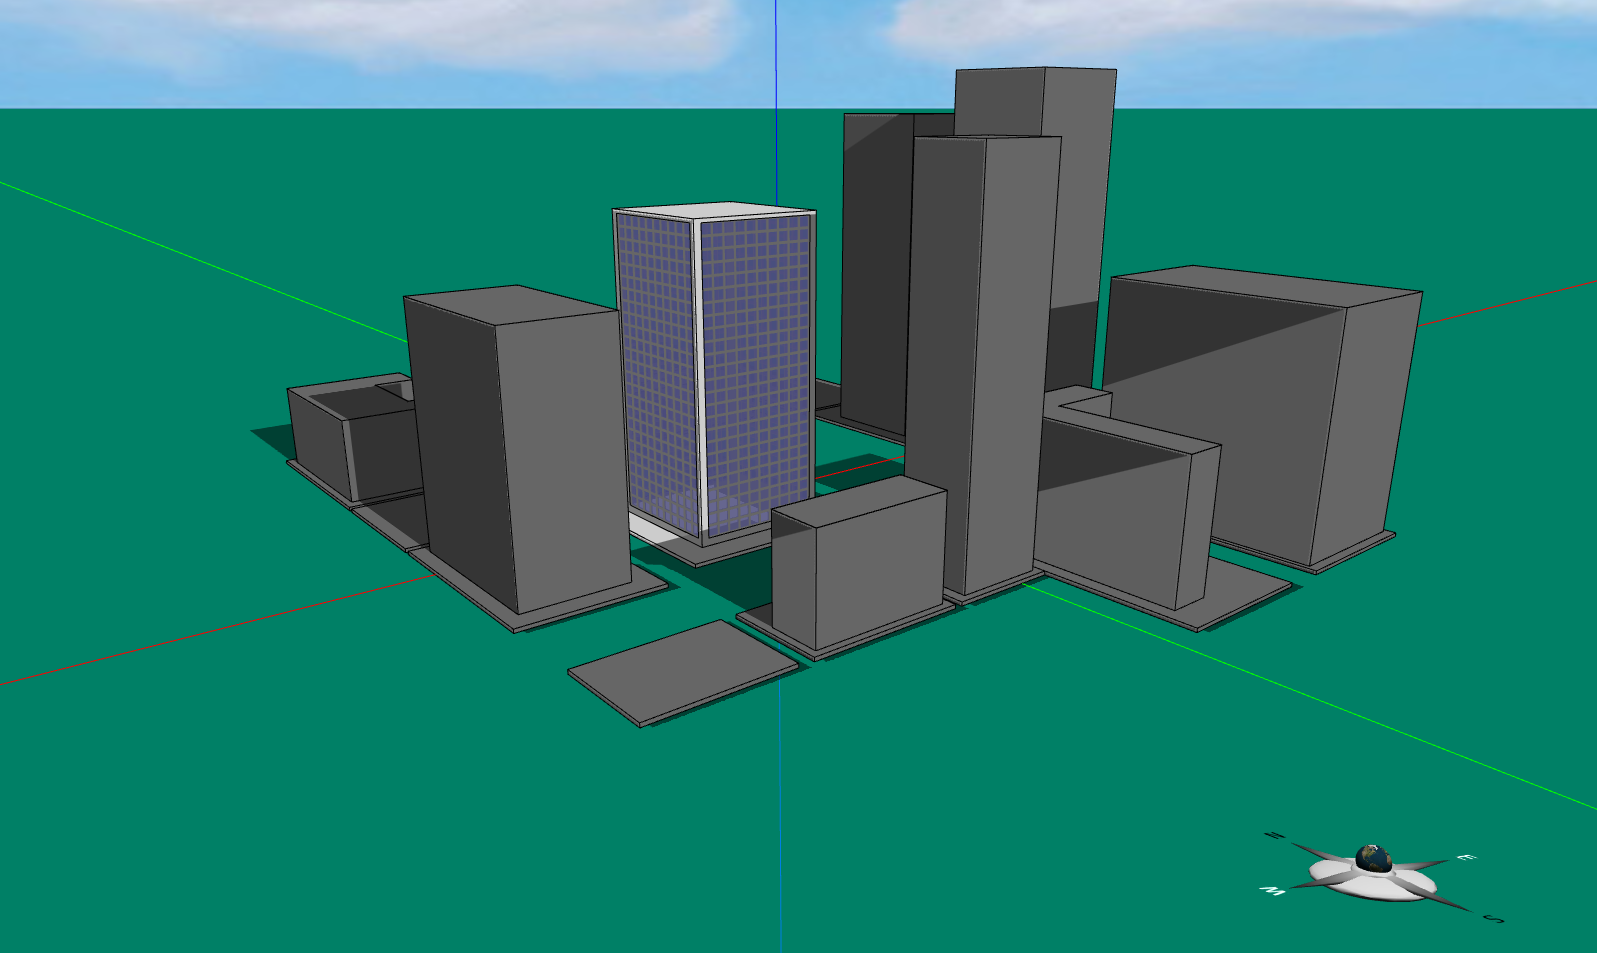
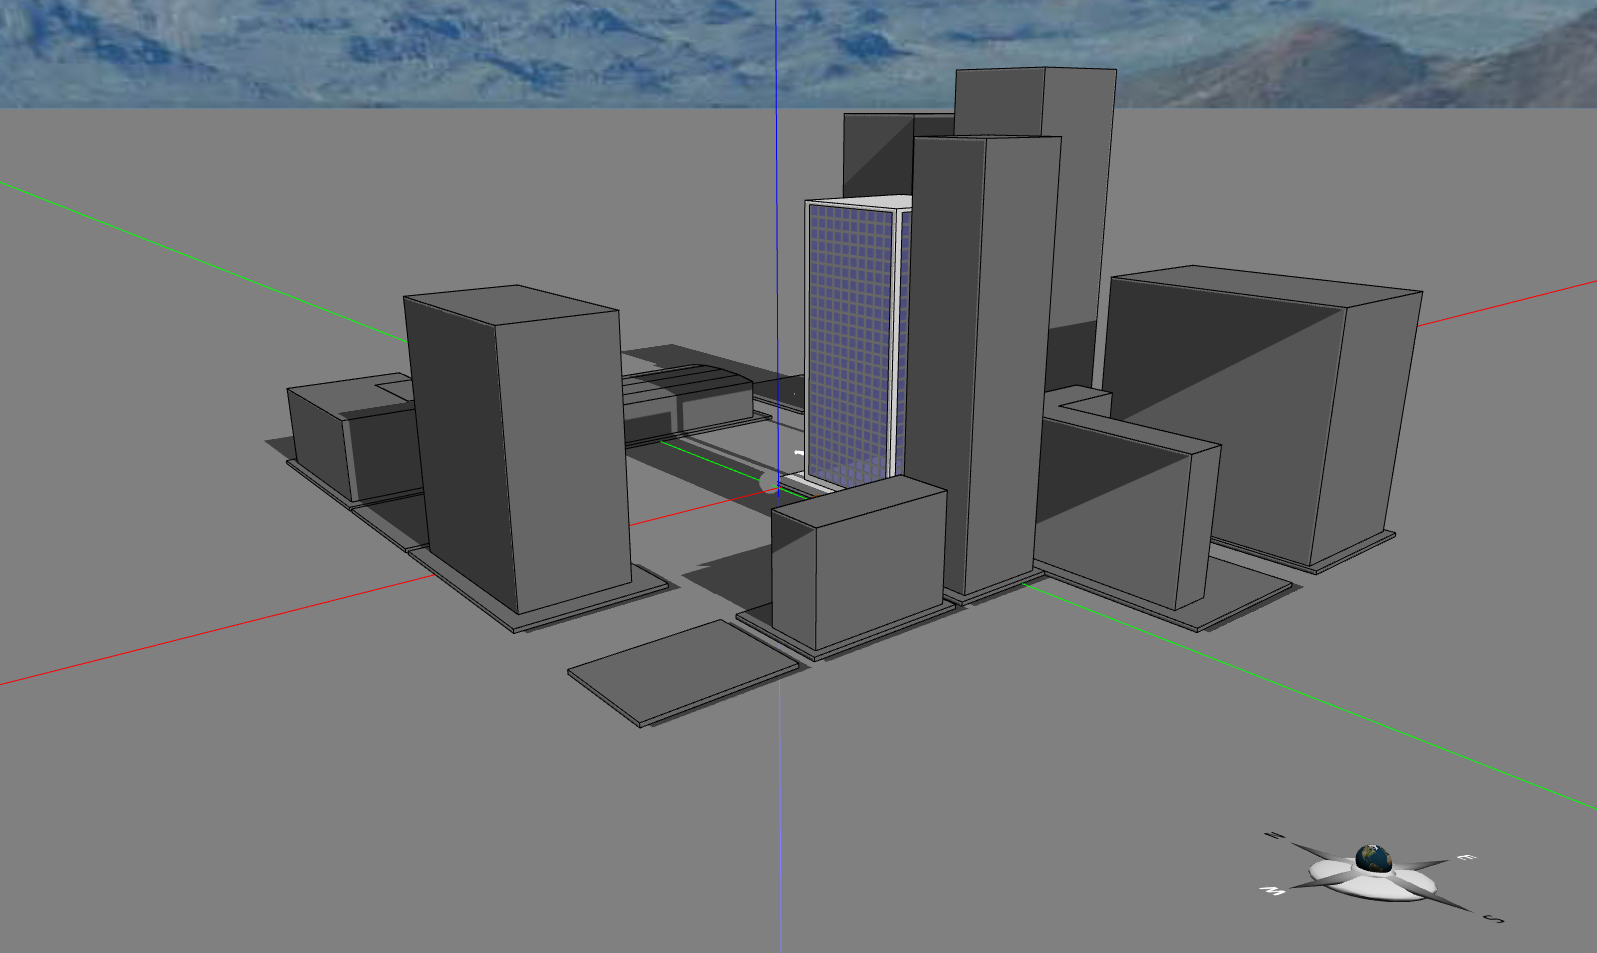
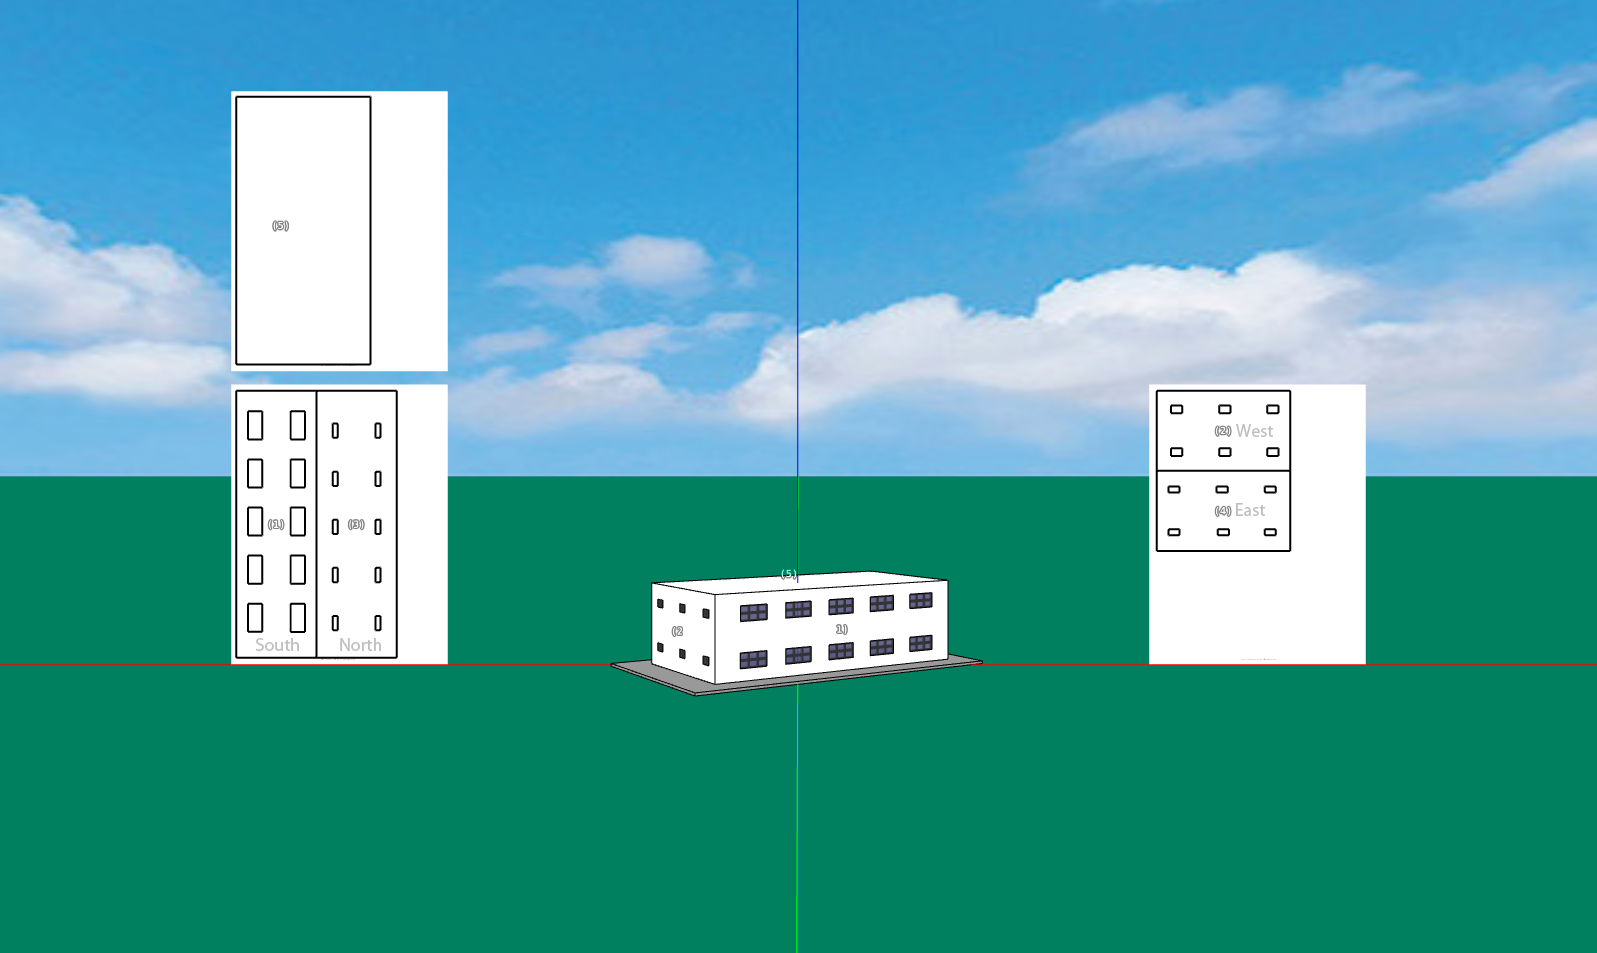
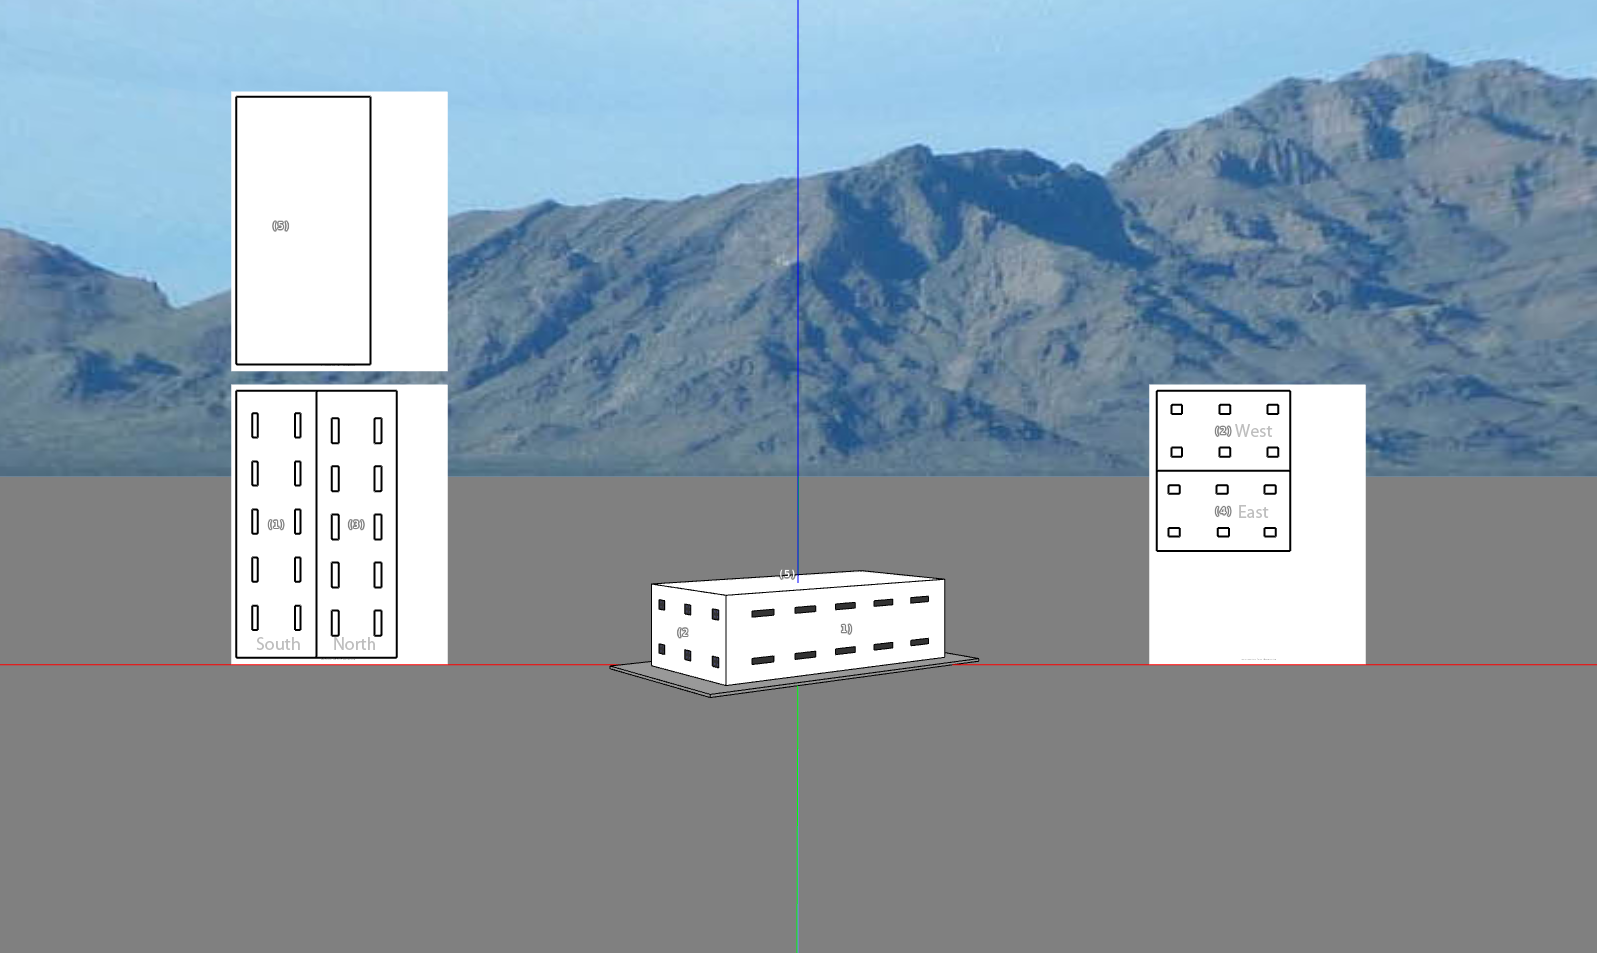
Fig. 4: Using four "octopuses" to locate four optimal orientations for the energy efficiency of a house.

Fig. 5: Locating the nearest optimum
When there are multiple optima in the solution space (a problem known as multimodal optimization), it may be appropriate to expect that AI would guide students to the nearest optimum. This may also be a recommendation by learning theories such as the Zone of Proximal Development introduced by Russian psychologist Lev Vygotsky. If a student is working in a certain area of the design space, guiding him or her to find the best option within that niche seems to be the most sensible instructional strategy. With a conventional genetic algorithm that performs global search with uniform initial selection across the solution space, there is simply no guarantee that the suggested solution would take the student's current solution into consideration, even though his/her current solution can be included as part of the first generation (which, by the way, may be quickly discarded if the solution turns out to be a bad one). The Octopus Algorithm, on the other hand, respects the student's current state and tries to walk him/her through the process stepwisely. In theory, it is a better technique to support advanced personalized learning, which is the number one in the 14 grand challenges for engineering in the 21st century posed by the National Academy of Engineering of the United States.

Let's see how the Octopus Algorithm finds multiple optima. Again, I have tested the algorithm with simple sinusoidal functions and found that it worked in those test cases. But I want to use a real-world example from Energy3D to illustrate my points. This example is concerned with determining the optimal orientation of a house, given that everything else has been fixed. By manual search, I found that there are basically four different orientations that could result in comparable energy efficiency, as shown in Figure 4.

Fig. 6: "A fat octopus" vs. "a slim octopus."
Now let's pick four different initial guesses and see which optimum each "octopus" finds. Figure 5 shows the results. The graphs in the left column show the normal distributions around the four initial guesses. The graphs in the right column show the final solutions to which the Octopus Algorithm converged. In this test case, the algorithm succeeded in ensuring nearest guidance within the zone of proximal development. Why is this important? Imagine if the student is experimenting with a southwest orientation but hasn't quite figured out the optimal angle. An algorithm that suggests that he or she should abandon the current line of thinking and consider another orientation (say, southeast) could misguide the student and is unacceptable. Once the student arrives at an optimal solution nearby, it may be desirable to prompt him/her to explore alternative solutions by choosing a different area to focus and repeat this process as needed. The ability for the algorithm to detect the three other optimal solutions simultaneously, known as multi-niche optimization, may not be essential.

Fig. 7. A "fatter octopus" may be problematic.
There is a practical problem, though. When we generate the normal distribution of solution points around the initial guess, we have to specify the standard deviation that represents the reach of the "tentacles" (Figure 6). As illustrated by Figure 7, the larger the standard deviation ("a fatter octopus"), the more likely the algorithm will find more than one optima and may lose the nearest one as a result. In most cases, finding a solution that is close enough may be good enough in terms of guidance. But if this weakness becomes an issue, we can always reduce the standard deviation to search the neighborhood more carefully. The downside is that it will slow down the optimization process, though.

In summary, the Octopus Algorithm that I have invented seems to be able to accurately guide a designer to the nearest optimal solution in an engineering design process. Unlike Paul the Octopus that relied on supernatural forces (or did it?), the Octopus Algorithm is an AI technique that we create, control, and leverage. On a separate note, since some genetic algorithms also employ tournament selection like the World Cup, perhaps Paul the Octopus was thinking like a genetic algorithm (joke)? For the computer scientists who happen to be reading this article, it may also add a new method for multi-niche optimization besides fitness sharing and probabilistic crowding.

Thursday, June 28, 2018

Computer Applications in Engineering Education Published Our Paper on CAD Research

Fig. 1: Integrated design and simulation in Energy3D
In workplaces, engineering design is supported by contemporary computer-aided design (CAD) tools capable of virtual prototyping — a full-cycle process to explore the structure, function, and cost of a complete product on the computer using modeling and simulation techniques before it is actually built. In classrooms, such software tools allow students to take on a design task without regard to the expense, hazard, and scale of the challenge. Whether it is a test that takes too long to run, a process that happens too fast to follow, a structure that no classroom can fit, or a field that no naked eye can see, students can always design a computer model to simulate, explore, and imagine how it may work in the real world. Modeling and simulation can thereby push the envelope of engineering education to cover much broader fields and engage many more students, especially for underserved communities that are not privileged to have access to expensive hardware in advanced engineering laboratories. CAD tools that are equipped with such modeling and simulation capabilities provide viable platforms for teaching and learning engineering design, because a significant part of design thinking is abstract and generic, can be learned through designing computer models that work in cyberspace, and is transferable to real-world situations.

Some researchers, however, cautioned that using CAD tools in engineering practices and education could result in negative side effects, such as circumscribed thinking, premature fixation, and bounded ideation, which undermine design creativity and erode existing culture. To put the issues in a perspective, these downsides probably exist in any type of tools — computer-based or not — to various extents, as all tools inevitably have their own strengths and weaknesses. As a matter of fact, the development history of CAD tools can be viewed as a progress of breaking through their own limitations and engendering new possibilities that could not have been achieved before. To do justice to the innovative community of CAD developers and researchers at large, we believe it is time to revisit these issues and investigate how modern CAD tools can address previously identified weaknesses. This was the reason that motivated us to publish a paper in Computer Applications in Engineering Education to expound our points of view and supporting them with research findings.

Fig. 2: Sample student work presented in the paper
The view that CAD is “great for execution, not for learning” might be true for the kind of CAD tools that were developed primarily for creating 2D/3D computer drawings for manufacturing or construction. That view, however, largely overlooks three advancements of CAD technologies:

1) System integration that facilitates formative feedback: Based on fundamental principles in science, the modeling and simulation capabilities seamlessly integrated within CAD tools can be used to analyze the function of a structure being designed and evaluate the quality of a design choice within a single piece of software (Figure 1). This differs dramatically from the conventional workflow through complicated tool chaining of solid modeling tools, pre-processors, solvers, and post-processors that requires users to master quite a variety of tools for performing different tasks or tackling different problems in order to design a virtual prototype successfully. Although the needs for many tools and even collaborators with different specialties can be addressed in the workplace using sophisticated methodologies such as 4D CAD that incorporate time or schedule-related information into a design process, it is hardly possible to orchestrate such complex operations in schools. In education, cumbersome tool switching ought to be eliminated — whenever and wherever possible and appropriate — to simplify the design process, reduce cognitive load, and shorten the time for getting formative feedback about a design idea. Being able to get rapid feedback about an idea enables students to learn about the meaning of a design parameter and its connections to others quickly by making frequent inquiries about it within the software. The accelerated feedback loop can spur iterative cycles at all levels of engineering design, which are fundamental to design ideation, exploration, and optimization. We have reported strong classroom evidence that this kind of integrated design environment can narrow the so-called “design-science gap,” empowering students to learn science through design and, in turn, apply science to design. 
2) Machine learning that generates designer information: For engineering education research, a major advantage of moving a design project to a CAD platform is that fine-grained process data (e.g., actions and artifacts), can be logged continuously and sorted automatically behind the scenes while students are trying to solve design challenges. This data mining technique can be used to monitor, characterize, or predict an individual student’s behavior and performance and even collaborative behavior in a team. The mined results can then be used to compile adaptive feedback to students, create infographic dashboards for teachers, or develop intelligent agents to assist design. The development of this kind of intelligence for a piece of CAD software to “get to know the user” is not only increasingly feasible, but also increasingly necessary if the software is to become future-proof. It is clear that deep learning from big data is largely responsible for many exciting recent advancements in science and technology and has continued to draw extensive research interest. Science ran a special issue on artificial intelligence (AI) in July 2015 and, only two years later, the magazine found itself in the position of having to catch up with another special issue. For the engineering discipline, CAD tools represent a possible means to gather user data of comparable magnitudes for developing AI of similar significance. In an earlier paper, we have explained why the process data logged by CAD software possess all the 4V characteristic features — volume, velocity, variety, and veracity — of big data as defined by IBM. 
3) Computational design that mitigates design fixation: In trying to solve a new problem, people tend to resort to their existing knowledge and experiences. While prior knowledge and experiences are important to learning according to theories such as constructivism and knowledge integration, they could also blind designers to new possibilities, a phenomenon known as design fixation. In the context of engineering education, design fixation can be caused by the perception or preconception of design subjects, the examples given to illustrate design principles, and students’ own previous designs. As it may adversely affect engineering learning to a similar degree as “cookbook labs” underrepresent science learning, design fixation may pose a central challenge to engineering education (though it has not been thoroughly evaluated among young learners in secondary schools). Emerging computational design capabilities of innovative CAD tools based on algorithmic generation and parametric modeling can suggest design permutations and variations interactively and evolutionarily, equivalent to teaming students up with virtual teammates capable of helping them explore new territories in the solution space.

To read more about this paper, click here to go to the publisher's website.

Friday, June 15, 2018

Maine Teacher Workshop on Artificial Intelligence in Engineering Education

In June 10-12, we hosted a successful teacher professional development workshop in York, Maine for 29 teachers from seven states. The theme was around the application of artificial intelligence (AI) in engineering education to assist teaching and foster learning. The workshop was supported by generous funding from General Motors and the National Science Foundation.

The teachers explored how the AI tools built in Energy3D could help students learn STEM concepts and skills required by the Next Generation Science Standards (NGSS), especially engineering design. Together we brainstormed how AI applications such as generative design might change their teaching. We believed that AI could transform STEM education from the following four aspects: (1) augment students with tools that accelerate problem solving, thereby supporting them to explore more broadly; (2) identify cognitive gaps between students' current knowledge and the learning goals, thereby enabling them to learn more deeply; (3) suggest alternative solutions beyond students' current work, thereby spurring them to think more creatively; and (4) assess students' performance by computing the distances between their solutions and the optimal ones, thereby providing formative feedback during the design process. The activities that the teachers tried were situated in the context of building science and solar engineering, facilitated by our Solarize Your World Curriculum. We presented examples that demonstrated the affordances of AI for supporting learning and teaching along the above four directions, especially in engineering design (which is highly open-ended). Teachers first learned how to design a solar farm in the conventional way and then learned how to accomplish the same task in the AI way, which -- in theory -- can lead to broader exploration, deeper understanding, better solutions, and faster feedback.

View my PowerPoint slides for more information.

Friday, June 1, 2018

Generative Design of Concentrated Solar Power Towers

In a sense, design is about choosing parameters. All the parameters available for adjustment form the basis of the multi-dimensional solution space. The ranges within which the parameters are allowed to change, often due to constraints, sets the volume of the feasible region of the solution space where the designer is supposed to work. Parametric design is, to some extent, a way to convert design processes or subprocesses into algorithms for varying the parameters in order to automatically generate a variety of designs. Once such algorithms are established, users can easily create new designs by tweaking parameters without having to repeat the entire process manually. The reliance on computer algorithms to manipulate design elements is called parametricism in modern architecture.

Parametricism allows people to use a computer to generate a lot of designs for evaluation, comparison, and selection. If the choice of the parameters is driven by a genetic algorithm, then the computer will also be able to spontaneously evolve the designs towards one or more objectives. In this article, I use the design of the heliostat field of a concentrated solar power tower as an example to illustrate how this type of generative design may be used to search for optimal designs in engineering practice. As always, I recorded a screencast video that used the daily total output of such a power plant on June 22 as the objective function to speed up the calculation. The evaluation and ranking of different solutions in the real world must use the annual output or profit as the objective function. For the purpose of demonstration, the simulations that I have run for writing this article were all based on a rather coarse grid (only four points per heliostat) and a pretty large time step (only once per hour for solar radiation calculation). In real-world applications, a much more fine-grained grid and a much smaller time step should be used to increase the accuracy of the calculation of the objective function.


Video: The animation of a generative design process of a heliostat field on an area of 75m×75m for a hypothetical solar power tower in Phoenix, AZ.

Figure 1: A parametric model of the sunflower.
Heliostat fields can take many forms (the radial stagger layout with different heliostat packing density in multiple zones seems to be the dominant one). One of my earlier (and naïve) attempts was to treat the coordinates of every heliostat as parameters and use genetic algorithms to find optimal coordinates. In principle, there is nothing wrong with this approach. In reality, however, the algorithm tends to generate a lot of heliostat layouts that appear to be random distributions (later on, I realized that the problem is as challenging as protein folding if you know what it is -- when there are a lot of heliostats, there are just too many local optima that can easily trap a genetic algorithm to the extent that it would probably never find the global optimum within the computational time frame that we can imagine). While a "messy" layout might in fact generate more electricity than a "neat" one, it is highly unlikely that a serious engineer would recommend such a solution and a serious manager would approve it, especially for large projects that cost hundreds of million of dollars to construct. For one thing, a seemingly stochastic distribution would not present the beauty of the Ivanpah Solar Power Facility through the lens of the famed photographers like Jamey Stillings.

In this article, I chose a biomimetic pattern proposed by Noone, Torrilhon, and Mitsos in 2012 based on Fermat's spiral as the template. The Fermat spiral can be expressed as a simple parametric equation, which in its discrete form has two parameters: a divergence parameter β that specifies the angle the next point should rotate and a radial parameter b that specifies how far the point should be away from the origin, as shown in Figure 1.

Figure 2: Possible heliostat field patterns based on Fermat's spiral.
When β = 137.508° (the so-called golden angle), we arrive at Vogel's model that shows the pattern of florets like the ones we see in sunflowers and daisies (Figure 1). Before using a genetic algorithm, I first explored the design possibilities manually by using the spiral layout manager I wrote for Energy3D. Figure 2 shows some of the interesting patterns I came up with that appear to be sufficiently distinct. These patterns may give us some ideas about the solution space.
Figure 3: Standard genetic algorithm result.
Figure 4: Micro genetic algorithm result.

Then I used the standard genetic algorithm to find a viable solution. In this study, I allowed only four parameters to change: the divergence parameter β, the width and height of the heliostats (which affect the radial parameter b), and the radial expansion ratio (the degree to which the radial distance of the next heliostat should be relative to that of the current one in order to evaluate how much the packing density of the heliostats should decrease with respect to the distance from the tower). Figure 3 shows the result after evaluating 200 different patterns, which seems to have converged to the sunflower pattern. The corresponding divergence parameter β was found to be 139.215°, the size of the heliostats to be 4.63m×3.16m, and the radial expansion ratio to be 0.0003. Note that the difference between β and the golden angle cannot be used alone as the criterion to judge the resemblance of the pattern to the sunflower pattern as the distribution also depends on the size of the heliostat, which affects the parameter b.

I also tried the micro genetic algorithm. Figure 4 shows the best result after evaluating 200 patterns, which looks quite similar to Figure 3 but performs slightly less. The corresponding divergence parameter β was found to be 132.600°, the size of the heliostats to be 4.56m×3.17m, and the radial expansion ratio to be 0.00033.

In conclusion, genetic algorithms seem to be able to generate Fermat spiral patterns that resemble the sunflower pattern, judged from the looks of the final patterns.

Thursday, May 24, 2018

Using Artificial Intelligence to Design a Solar Farm

Everyone loves to maximize the return of investment (ROI). If you can effortlessly find a solution that pays a higher profit -- even only a few dollars more handsomely, why not? The problem is that, in many complicated engineering cases in the real world, such as designing a solar farm, we often don't know exactly what the optimal solutions are. We may know how to get some good solutions based on what textbooks or experts say, but no one in the world can be 100% sure that there aren't any better ones waiting to be discovered beyond the solution space that we have explored. As humans, we can easily get complacent and settled with the solutions that we feel good about, leaving the job (and the reward) of finding better solutions to another time or someone else.

Artificial intelligence (AI) is about to change all that. As design is essentially an evolution of solutions, AI techniques such as genetic algorithms (GA) are an excellent fit to the nature of many design problems and can generate a rich variety of competitive designs in the same way genetics does for biology (no two leaves are the same but they both work). These powerful tools have the potential to help people learn, design, and discover new things. In this article, I demonstrate how GA can be used to design a photovoltaic (PV) solar farm. As always, I first provide a short screencast video in which I used the daily output or profit as the objective function to speed up the animation so that you can see the evolution driven by GA. The actual assessments are based on using the annual output or profit as the objective function, presented in the text that follows the video. Note that the design process is still geared towards a single objective (i.e., the total output in kWh or the total profit in dollars over a given period of time). Design problems with multiple objectives will be covered later.


In GA, the solution depends largely on the choice of the objective function (or the fitness function), which specifies how the main goal is calculated. For example, if the main goal is to generate as much electricity as possible on a given piece of land without the concern of the cost of the solar panels, a design in which the solar panels are closely packed may be a good choice. On the other hand, if the main goal is to generate as much electricity as possible from each individual solar panel because of their high price, a design in which rows of solar panels are far away from one another would be a good choice. Unsurprisingly, in the case shown in the video, a single row of solar panels was found as the best solution. Aiming at maximizing the profit, the real-world problems always lie between these two extremes, which is why they must be solved using the principles of engineering design. The video above clearly illustrates the design evolution driven by GA in the three cases (the two extremes and an intermediate).

Figure 1. An Energy3D model of an existing solar farm in Massachusetts.
To test the usefulness of the GA implementation in Energy3D for solving real-world problems, I picked an existing solar farm in Massachusetts (Figure 1) to see if GA could find better solutions. A 3D model of the solar farm had been created in the Virtual Solar Grid based on the information shown on Google Maps and its annual output calculated using Energy3D. Because I couldn't be exactly sure about the tilt angle, I also tweaked it a bit manually and ensured that an optimal tilt angle for the array be chosen (I found it to be around 32° in this case). The existing solar farm has 4,542 solar panels, capable of generating 2,255 MWh of electricity each year, based on the analysis result of Energy3D. [I must declare here that the selection of this site was purely for the purpose of scientific research and any opinion expressed as a result of this research should be viewed as exploratory and should not be considered as any kind of evaluation of the existing solar farm and its designer(s). There might be other factors beyond my comprehension that caused a designer to choose a particular trade-off. The purpose of this article is to show that, if we know all the factors needed to be considered in such a design task, we can use AI to augment our intelligence, patience, and diligence.]

Figure 2. The results of 10 iterations.
Energy3D has a tool that allows the user to draw a polygon within which the solar farm should be designed. This polygon is marked by white lines. Using this tool, we can ensure that our solutions will always be confined to the specified area. I used this tool to set the boundary of the solar farm under design. This took care of an important spatial constraint and guaranteed that GA would always generate solutions on approximately the same land parcel as is situated by the existing solar farm.

For the objective function, we can select the total annual output, the average annual output of a solar panel, or the annual profit. I chose the annual profit and assumed that the generated electricity would sell for 22.5 cents per kWh (the 2018 average retail price in Massachusetts) and the daily cost of a solar panel (summing up the cost of maintenance, financing, and so on) would be 20 cents. I didn't know how accurate these ROI numbers would be. But let's just go with them for now. The annual profit is the total sale income minus the total operational cost. Qualitatively, we know that a higher electricity price and a lower operational cost would both favor using more solar panels whereas a lower electricity price and a higher operational cost would both favor using less solar panels. Finding the sweet spots in the middle requires quantitative analyses and comparisons of many different cases, which can be outsourced to AI.

Figure 3: The best design from 2,000 solutions
Figure 4: The second best design from 2,000 solutions.
In Energy3D, GA always starts with the current design as part of the first generation (so if you already have a good design, it will converge quickly). In order for GA not to inherit anything from the existing solar farm, I created an initial model that had only a rack with a few solar panels on it and a zero tilt angle. The size of the population was set to be 20. So at the beginning, this initial model would compete with 19 randomly generated solutions and was almost guaranteed to lose the chance to enter the next generation. In order to stop and check the results, I let GA run for only 10 generations. For convenience, let's call every 10 generations of GA evolution an iteration. Figure 2 shows that GA generated solutions below the supposed human performance in the first two iterations but quickly surpassed it after that. The solution kept improving but got stuck in iterations 5-7 and then it advanced again and stagnated again in iterations 8-10. This process could continue indefinitely, but I decided to terminate it after 10 iterations, or 100 generations. By this time, the software had generated and evaluated 2,000 solutions, which took a few hours as it had to run 2,000 annual simulations for thousands of solar panels.

The best solution (Figure 3) that emerged from these 2,000 generated solutions used 5,420 solar panels fixed at a tilt angle of 28.3° to generate 2,667 MWh per year and was about 16% better than the existing one based on the ROI model described above. The second best solution (Figure 4) used 4,670 solar panels fixed at a tilt angle of 38.6° to generate 2,340 MWh per year and was about 5.5% better than the existing one based on the ROI model. Note that if we use the average annual output per solar panel as the criterion, the second best solution would actually be better than the best one, but we know that the average panel output is not a good choice for the fitness function as it can result in an optimal solution with very few solar panels.

In conclusion, the generative design tools in Energy3D powered by AI can be used to search a large volume of the solution space and find a number of different solutions for the designer to pick and choose. The ability of AI to transcend human limitations in complex design is a significant application of AI and cannot be more exciting! We predict that future work will rely more and more on this power and today's students should be ready for the big time.

Friday, May 18, 2018

Using Artificial Intelligence to Design Energy-Efficient Buildings

The National Science Foundation issued a statement on May 10, 2018 in which the agency envisions that "The effects of AI will be profound. To stay competitive, all companies will, to some extent, have to become AI companies. We are striving to create AI that works for them, and for all Americans." This is probably the strongest message and the clearest matching order from a top science agency in the world about a particular area of research thus far. The application of AI to the field of design, and more broadly, creativity, is considered by many as the moonshot of the ongoing AI revolution, which is why I have chosen to dedicate a considerable portion of my time and effort to this strategically important area.

I have added two more application categories of using genetic algorithms (GAs) to assist engineering design in Energy3D, the main platform based on which I am striving to create a "designerly brain." One example is to find the optimal position to add a new building with glass curtain walls to an open space in an existing urban block so that the new building would use the least amount of energy. The other example is to find the optimal sizes of the windows on different sides of a building so that the building would use the least amount of energy. To give you a quick idea about how GAs work in these cases, I recorded the following two screencast videos from Energy3D. To speed up the search processes visualized in the videos, I chose the daily energy use as the objective function and only optimized for the winter condition. The solutions optimized for the annual energy use are shown later in this article.


Figure 1: A location of the building recommended by GA if it is in Boston.
Figure 2: A location of the building recommended by GA if it is in Phoenix.
For the first example, the energy use of a building in an urban block depends on how much solar energy it receives. In the winter, solar energy is good for the building as it warms up the building and saves the heating energy. In the summer, excessive heating caused by solar energy must be removed through air conditioning, increasing the energy use. The exact amount of energy use per year depends on a lot of other factors such as the fenestration of the building, its insulation, and its size. In this demo, we only focus on searching a good location for a building with everything else fixed. I chose a population with 32 individuals and let GA run for only five generations. Figures 1 and 2 show the final solutions for Boston (a heating-dominant area) and Phoenix (a cooling-dominant area), respectively. Not surprisingly, the GA results suggest that the new building be placed in a location that has more solar access for the Boston case and in location that has less solar access for the Phoenix case.

Figure 3: Window sizes of a building recommended by GA for Chicago.
Figure 4: Window sizes of a building recommended by GA for Phoenix.
For the second example, the energy use of a building depends on how much solar energy it receives through the windows and how much thermal energy transfers through the windows (since windows typically have less thermal resistance than walls). In the winter, while a larger window allows more solar energy to shine into the building and warm it up during the day, it also allows more thermal energy to escape through the larger area, especially at night. In the summer, both solar radiation and heat transfer through a larger window will contribute to the increase of the energy needed to cool the building. And this complicated relationship changes when the solution is designed for a different climate. Figures 3 and 4 show the final solutions for Chicago and Phoenix as suggested by the GA results, respectively. Note that not all GA results are acceptable solutions, but they can play advisory roles during a design process, especially for novice designers who do not have anyone to consult with.

In conclusion, artificial intelligence such as GA provides automated procedures that can help designers find optimal solutions more efficiently and thereby free them up from tedious, repetitive tasks if an exhaustive search of the solution space is necessary. Energy3D provides an accessible platform that integrates design, visualization, and simulation seamlessly to demonstrate these potential and capabilities. Our next step is to figure out how to translate this power into instructional intelligence that can help students and designers develop their abilities of creative thinking.